This is a follow up to my post about using Audio software to measure PWM.
Also Terry Oregon’s post about sensors
One of mine about building a sensor based on Terry’s work
ToyKeeper’s post about seeing PWM
And here is a post from maukka about flicker visibility
Using audio spectrum analysis software gives us a look at the frequency of the PWM and it can hint at the character owing to the harmonics. A good square wave yields a full set of harmonics running up the frequency band while a good sine wave will have no harmonics.
What the spectrum doesn’t show is what the waveform is doing. A slower PWM that is on for most of the on-off cycle might be quite usable. While a similar PWM frequency that is off for most of the cycle might be very annoying.
PWM showing: Low - Medium - High


Here is a link to a video from Terry that shows a PWM cycling through the ramping cycle.

When I thought about looking into this, I figured there might be limited software available.
I was bad wrong. There is a plethora of information and software to do this sort of thing out there (I knew I’d get to use that word someday).
Terry’s post is the best example of converting photons to volts.
There are many free to use software packages that use a soundcard as an input device and provide varying degrees of sophistication in signal analysis. But there are some shortcomings that might render the whole idea less than ideal.
What’s the downside of SCO (Soundcard O-Scope)?
Using the soundcard as an input has its limits (literally).
First is the frequency. Most soundcards have a 48KHz sample rate limiting bandwidth to 24KHz. As the signal approaches the upper Freq. limits, the number of samples covering the wavelet gets smaller. As such the rendition of a complex wave is distorted. A 48KHz card has real problems looking at a 16.5KHz wave. There are just not enough samples to work with. Google Nyquist for more info.
There are soundcards that have 96KHz or even 192KHz sample rates. These are usually an add-on item and can cost as much as a cheap O-scope (see below). The least expensive 192KHz soundcards I found are of the internal variety and cost about $40 (Creative and ASUS).
External USB 192K cards are pushing $100 (and more).
If someone knows of an inexpensive 96K or 192K external USB card with a line level input, please let us know.
Soundcard are, well, soundcards. They are mostly designed for output. They convert digital signals (music) into analog (voltages) to plug into an external sound system (5.1 or 7.1 outputs). At most they will have a 2 channel LINE input and a 2 channel (or sometimes mono) MIC input.
What we really need is a card designed for analog signals that converts to digital for input into the computer. There are plenty of these around and (some) only cost a bit more than an external USB soundcard. They also come with preamp front-ends that take’s care of (some) of the worries about matching voltages and impedance.
Take a look at these units from the music biz side of things:
https://www.sweetwater.com/store/detail/UMC202HD—behringer-u-phoria-umc202hd-usb-audio-interface
https://www.sweetwater.com/store/detail/OnyxProducer22—mackie-onyx-producer-2-2-usb-audio-interface
192KHz sample rate with 24 bit depth. Now I’ve not tried these, but I assume this could work as a front-end for analyzer software. If it worked, it would be way ahead of a soundcard designed for playing music.
There are also USB logging devices designed for all sorts of inputs. Most of these cost a significant amount.
I did find this:
It looks like a nifty toy that plays way more tricks than a simple DAC (In the $150 range).
Matching Voltages
You are hooking a voltage source to a soundcard that has a limited voltage input. Goof on the input side and things could go POP. Care in designing the sensor should make this a non-issue.
Soundcards are all AC coupled (as far as I know). Meaning the soundcard won’t see a DC voltage. Watch a signal strength meter and apply a DC voltage. The input will jump for a moment to reflect the change in state, then the signal meter will return to zero. In our case a sensor could be putting out a DC voltage and we would never see it unless we picked up that first initial DC pulse. Real O-Scopes have DC coupling and can show a DC voltage. Standalone scopes have DC and AC both. The Hantek USB scope (mentioned below) is DC only.
The frequency limits of a 48KHz soundcard clearly effects the ability to see higher frequency waveforms. Purchasing an external USB 192KHz card only makes sense if you are going to use it for something in addition to messing with flashlights. Get a real scope instead. One of the $40 internal cards?
Maybe - I’m still leaning toward a real scope for twice or 4 times that amount.
How Much Does a Real Scope Cost?
A small O-scope with a 2.4” screen can be had for less than $45. These look like they would work, but if you are going to spend $40 why not drop a bit more for the real thing. A USB O-scope can be had for about $70.
The prime example is the entry level Hantek 6022BE dual channel (it’s not a great scope (according to many tech oriented sites), but will do everything we want it to).
http://www.hantek.com/en/ProductDetail_31.html
Because it is so cheap there are many sites devoted to mods and there are alternative software packages written by the EE and HAM communities. It gets mixed reviews, so be sure to get it someplace with a return policy – just in case.
Stepping up - the PICO 2204A scope comes with a 5 year warranty and much better software for about $145. See:
You can download the PICO scope software for free and play with it in demo mode with the built in signal generator. Find the software here:

The PICO scope software has crashed on two different systems of mine. I don’t have the hardware so I was using it in demo mode. At least you can try before your buy.
If you just want to measure a PWM frequency, a solar cell and a DMM with frequency function is all you need. (You always wanted a better DMM anyway). And there are DMMs with O-scope screens (for a price).
The Hardware
With that in mind, here’s what can be done for less than $15 in parts (way less). First a sensor is needed to convert photons to volts. A simple PV cell will work - but gives less than stellar waveforms. I bought mine for about $3 someplace. Terry ripped one out of a solar powered calculator. These things are everywhere in cheap solar rechargeable thingies. Lots of these are on ebay for $1 or so. You don’t need anything big to do this.
One of the photo diodes used by Terry or the one in my post (see above) gives a much faster response to changes in voltage. They are in the $3 to $12 range.
Speaking of voltage, using a 1.2 volt battery as the power supply puts one of these circuits within or very near the safe limits of a LINE Level soundcard. Using a higher voltage battery for supply power requires limiting the sample voltage.

Using a pair of diodes in opposition across the sensor output will limit the voltage. Above .7V or so the signal will clip. Use 4 diodes, two in series, in parallel with a second pair (oriented in the opposite direction) will bump the limit to 1.4V or so. A 1N4148 is really cheap and works well.
Also see links in Terry’s post about other methods to get a correct input.
Building a simple resistor circuit will divide the voltage into something safe. To do it correctly the input impedance on the soundcard needs to be known and plugged into a formula.
But this here aren’t rocket science (at least when I’m doing it).
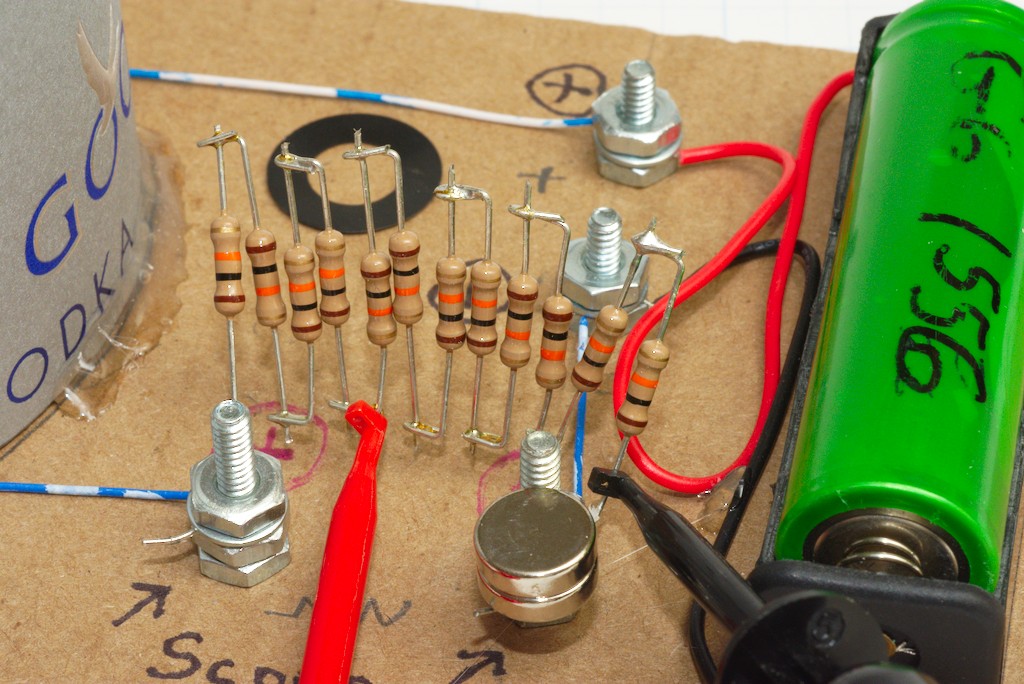
Here is a shot of my setup with a bunch of 10K resistors in series.
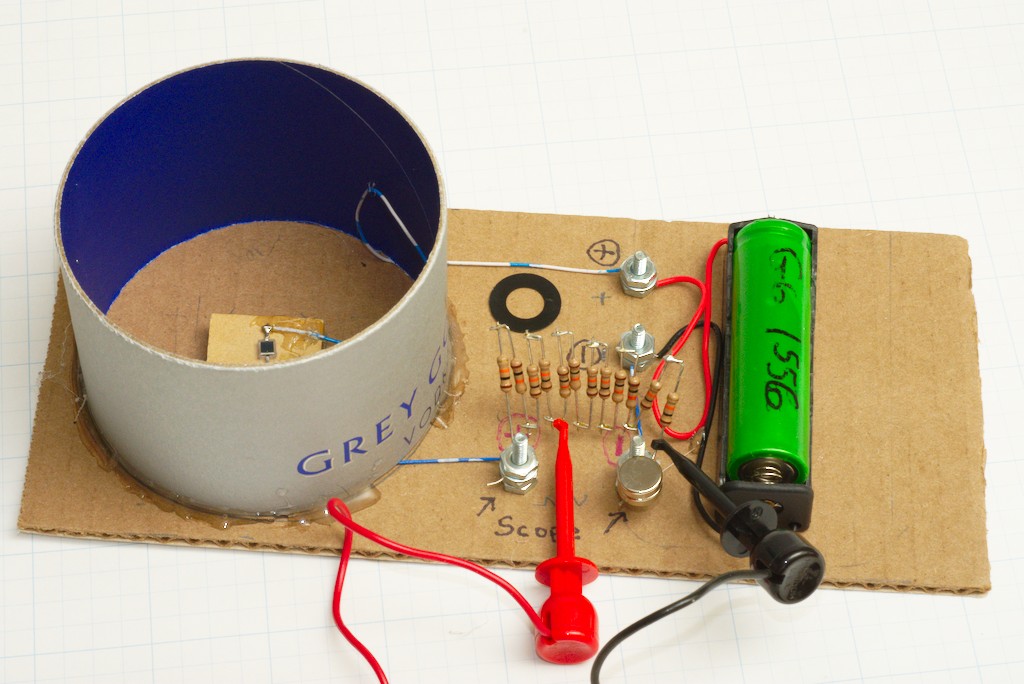
Just measure the voltage across the output with the sensor bypassed to check the max voltage.
Better still, build something with a POT to vary the output voltage. See Terry’s post for examples.
These simple designs are good for a battery powered sensor.
Here is an article about building a voltage limiting input for a soundcard scope.
You need something better if you are going to be looking at higher voltages or something connected to the mains. Remember that the ground is connected straight through from the source to the soundcard to the PC to the wall.
There are designs out there for way more sophisticated front ends for soundcard input.
But we are keeping things cheap (Err… Budget).
It makes a lot of sense to use an external soundcard to prevent the built in one from getting smoked. Many users are getting satisfactory results with an ultra cheap card like this one.
https://www.dx.com/p/usb-virtual-7-1-channel-external-sound-card-adapter-2009693
Here is a link to an article about using this soundcard with a fancier front-end:
http://www.epanorama.net/newepa/2012/05/08/usb-soundcard-to-digital-storage-oscilloscope/
Given a choice, finding something that lists a LINE level input is preferable to a MIC only input. But it seems these cheap cards with a MIC input are being used with good results.
The Behringer external card is very robust and has an excellent noise floor:
https://www.amazon.com/Behringer-U-Control-UCA202-Ultra-Low-Interface/dp/B000KW2YEI/ref=sr_1_1?crid=14CABBY6ZGN2D&keywords=behringer+usb+sound+card&qid=1558643975&s=gateway&sprefix=berringer+usb+sound+ca%2Caps%2C161&sr=8-1
It’s overkill for what we are doing. For audio signals, it could be just the ticket. Still it’s only 48KHz and it costs nearly a third of a cheap USB O-scope. So keep that in mind.
Controlling the Photons
Here is one of the problems encountered when testing flashlights. A light ramped to near turbo is a GaBillion times brighter than that .25 lumen moonlight mode (That’s a real term - I read in on the Web so I know it’s true).
That’s a real problem with any sensor. Something sensitive enough to see moonlight mode will most likely be pushed past its limits when something vastly brighter than the sun hits it.
Terry got around this problem by testing lights in the dark and aiming the lights away from the sensor until he got a good value.
I did it by making a lid for the sensor and using filters to cut down on the light to prevent the diode from clipping the signal.
Doing it in the dark is the easiest method. My version can be used with the lights on.
Getting The OS to see the soundcard.
In Windows 10 the setting was a little obstinate. I had to turn off the MIC input and turn on the Line input to get it going.

A plus here was allowing the speakers to monitor the signal.

I could hear the PWM singing and the volume gave me a clue as to how hard the card was being driven.

The SCO software
Little did I know how much stuff is out there. Here are just a few examples.
Soundcard Oscilloscope
Available here:
This is a free for home use application. I am using it on Windows 10 64Bit. The interface looks like a conventional standalone scope with knobs and buttons to change values. Seems to me there is a lot of wasted space that could be used for a larger display.

Here you can see the difference between a PV cell (top trace) and one of the diodes (bottom trace). These are the lights in my office. Notice the fine details in the lower trace masked by the solar cell.
This software also has a frequency spectrum display.

The Frequency display can be linear both in scale and amplitude. Better, I think, that the log scales seen in the audio software.
The nice thing about this software is it’s easy to use. Just fiddle with the settings till you get something useful on the screen. The trigger seems stable. The software has features that go above and beyond what I use for looking at PWM. It gives you a taste of what having a real O-scope would be like
Here’s a blast from the past. Remember the EternaLight?

Here is the EternaLight PWM sitting underneath the 120Hz near sine wave of my office lights.

Here is that same 120Hz wave. This time the bottom trace is a C8 running the Guppydrv at 16KHz.

One thing I found lacking was the absence of an invert option (or at least I couldn’t find it). It seems my soundcards invert the signal so that what I was seeing was bassackwards from what it should be. I got around this by reversing the sensor inputs.
On this package there is not (or I can’t find) any way to make the traces bolder. That would be really helpful for screen captures.
It has screen capture in color or B&W (handy for publication in print format)
I stopped the scope when I liked what I saw and use Window Snipping tool to grab the screen.
And it will do X-Y plots
Here is a shot for ToyKeeper crank up the persistence and draw with sound.

I much prefer the Frequency screen on this one verses the package below.
Visual Analyzer
Available here:
I’m using it in Window 10-64Bit. There is an installable version and a standalone version that runs from an .exe file. That’s kind of a nice option. Try it on different systems without having to install it. Once again the lights in my office.

Whoa-Momma –Holy Fast Fourier transform Batman. This is some kind of heavy duty stuff. The UI is designed for GUI instead of mimicking an analogue scope. The main screen has the O-scope view sitting above a frequency spectrum. This package takes more fussing to get things adjusted. There is way more here in the way of signal analyses than I have a clue about using.
For some reason I don’t seem to be able to set the timings to divisions that make sense. Like even numbers?! I’m sure I’m doing something wrong.
This one has invert options so I didn’t need to flip my inputs.
I did seem to have more trouble getting a good trigger with this software. Signals that were easy to sync on the previous software I had trouble catching with Visual Analyzer. Likely I’m the one to blame.
Still just stopping the capture freezes the screen and that worked for me. This software has the ability to make the traces bolder which makes a screen capture easier to see.
The screen capture is very sophisticated. It’s not just a picture of the output. There are adjustments that can be made in the capture screen – screen. There are separate captures for the O-scope and the Frequency display as well as a bunch of other things beyond my pay grade.
Clicking a few buttons gets us even more information

Once again I just used Window Snipping Tool to grab the whole thing.

And still more goodies to look at. This software makes buying into a higher bit rate soundcard something to think about.
Did I Learn Anything
I did. On Lights with PWM significantly below the 24KHz limit the waveform can be seen and the frequency analyses will give you a look at the frequencies.


The software can also measure the frequency of a lights strobe function
Thrunight T14 Strobing at 12.5Hz

On lights with a fast PWM the waveform is distorted. For example here is a look at fast PWM.
Here is my C8

And again on a real O-scope.

You can also miss small but significant ambiguities. Take a look at the leading edge of this trace.

See the big overshoot before the main square wave? The soundcard sample rate was too slow to see this.
Lights with a PWM outside the sampling frequency give no indication of having a PWM. Terry mentioned Biscotty uses a 35KHz in one of the modes. I have an Olight that that puts a sine wave ripple on top of it’s DC voltage. It appears (if I’m doing the math right) to have a 250KHz frequency. No sound card could sample this.
So for a few bucks in parts, and a free software download, there is additional information to be gained as compared to looking at PWM frequency in audio spectrum software or a frequency counter on a DMM. However keep the sampling frequency in mind when considering using this method.
Still More Software
There are others that I haven’t tried yet. Some of these date from the XP era and could be used on an older system rescued from the depths of the closet. Google any ye shall find. For the programmer out there software is available to create tools from high level scripts. And several of these things seem to be using Python.
Here are a few more on the easier to use end of things (I haven’t tried these yet)
Winscope
Available here:
http://www.zen22142.zen.co.uk/Prac/winscope.htm
Real-time Spectrum
Avalible here:
https://www.phon.ucl.ac.uk/resource/sfs/rtspect/