I'm not sure how to go about it except with graph paper and a pencil. I need to plot on 2 sides. Left would be light output, bottom time and right temperature.
There are various Graph software out there, even free downloads. Even Photoshop CS series has plugins for it for creating Graphs. Some electronic test equiptment comes with Data Interface capability ( USB, COM port, etc.) and software that works with it to create a time-line sttyle graphs.
You can use software like Microsoft Excel or LibraOffice Calc.
Thanks guys. I'll check them out. As I'm pretty simple the program will have to be as well. Normally the kids can help me out but this had them tossed. Word you can do 2 but I dont think 3 things.
Hi
You might be able to do it in
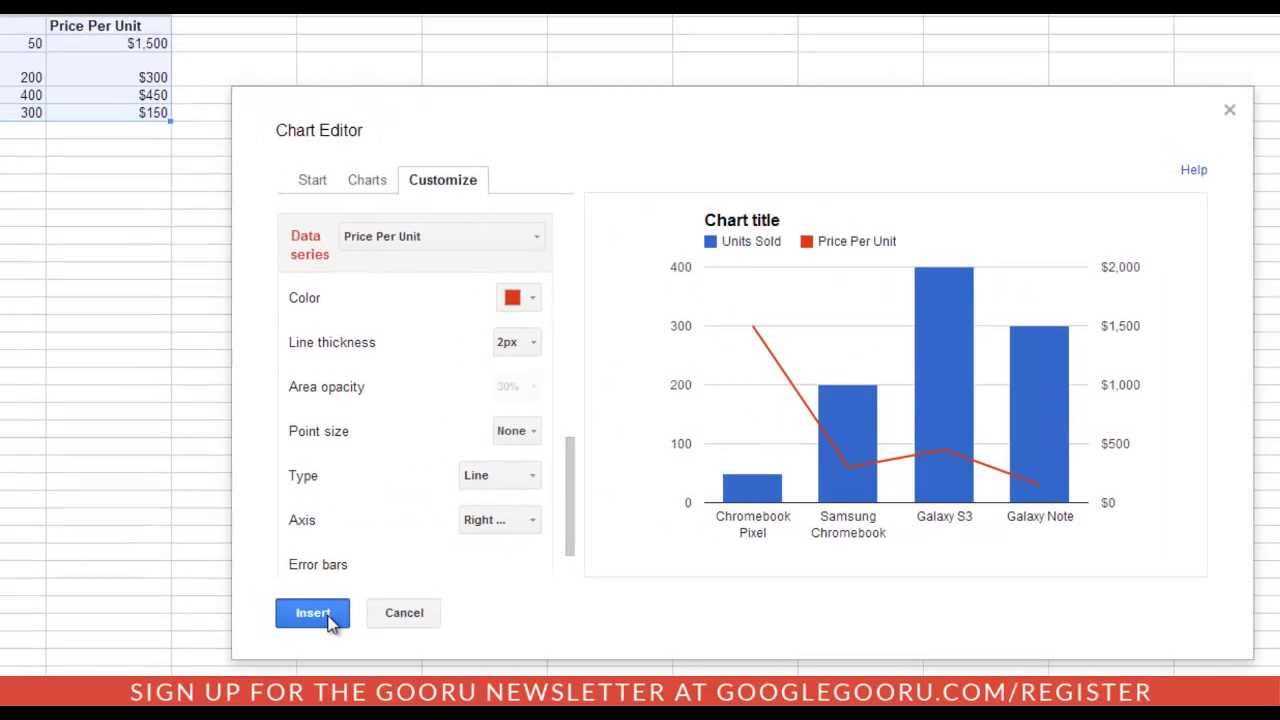
How to Add a Second YAxis to a Chart in Google Spreadsheets
The graphing in Google Docs is not good. Every time I’ve tried to use it I’ve come away frustrated. I’m sorry can’t give specific details, it’s been a while since the last time I made an attempt. I’d stick with Excel or Calc. (Google does have a separate charting product, I wouldn’t call it simple to use though)
I make my graphs in excel. I'm not an expert, it took some time to figure out things, like second y-axis, and interpolation of missing y-values and such. Most of excel is still a mystery though.
LOL. Most programs to me are a mystery. 
Thanks again guys.