Inter-reviewer comparison of luminous flux (lumens) measurements

There are several reputable reviewers that present runtime graphs showing the integrated OTF luminous flux as a function of time. The data is valuable and appreciated as most of us can’t do that.

Understandably, given different setups, calibration, or even the individual sample of the flashlight being reviewed those measurements will inevitably vary. But by how much and how likely it is that the reviewers have systematic bias?

To have a glimpse, I looked at 4 reviews (@tactical_grizzly, @zeroair, @1Lumen, and @PiercingTheDarkness) of the same flashlight model - Wurkkos TS23. I tried to extract the lumens values at 4 different intensity levels from each of the reviews the best I could. I summarised it in the graph below, which is an extension of the standard Bland-Altman plot, but plotting the difference of the value reported by each reviewer at each intensity level (after it becomes constant) vs. the average of all four (since we don’t know the ‘true’ value).
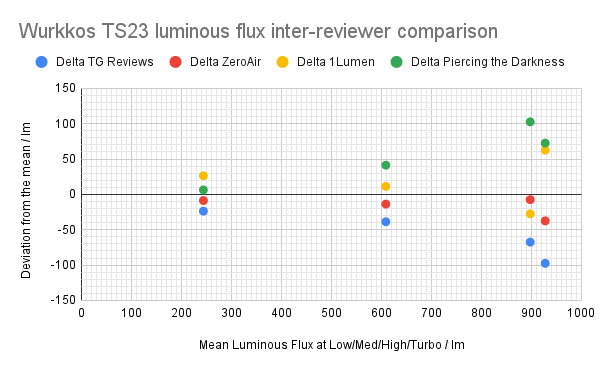
Wurkkos TS23 luminous flux inter-reviewer comparison

Whether those differences are consequential or not is debatable. Overall, the relative difference from the mean are within around 10% of the mean (but more if you compare the differences between individual reviewers rather than the difference from the mean), which is what the reviewers usually claim.

So for example, at the high level or some 900 lm average, the individual reports may vary from about 800 to 1000 lm - about 200 lm or some 20% difference, which is not trivial, albeit unlikely highly visually significant.

Interestingly, there seems to be a systematic bias involved - some reviewers report values generally higher (or lower) than others across the levels.

A word of caution on interpreting the plot above: since nobody knows what the true lumens are, the arbitrary baseline (zero line) is taken as the arithmetic mean of all four attempts at measuring the true value (at each level). The individual measurements may straddle the true values or, just as likely, can be all systematically too high or too low. By extension, it means that being close to the zero line is immaterial to assessing the accuracy of a reviewer - without a standard there is no way of assessing which dataset/reviewer is most accurate - one can only quantify how different they are from one another.

2 Thanks

@selfbuilt’s article that gives a taste of what light testers may be up against:

https://flashlightreviews.ca/index.php/methodology/lightbox-design/

I wonder if these reviewers don’t have DIY spheres. For the mass of lights they review (and the reach they have with their reviews in the market) I expected that they have at least some sort of well-designed equipment…

1 Thank

I usually don’t use the included cell for my measurements, so that’s why mine are the highest. You can’t really compare too well without the same cell, same ambient temp, same test setup and calibration etc.

Tbh, I just see lumen testing as a rough guide, I’m most interested in the stepdowns and sustained output.

4 Thanks

Only 1lumen’s team use spheres, I think one still uses a PVC Tube. The other 3 including myself just have a PVC Tube.

1 Thank

Would the battery make a difference in a light with boost driver when only flat, constant output portions of the runtime are compared?

A relative error of 10% from the mean (and presumably true value) is already good, considering that LED manufacturers impose a tolerance as much as 7% in luminous flux.

To test whether the difference in review numbers is partly due to LED binning, it might be sensible to compare reviews of multi-emitter lights, as many emitters in the same light as possible. As the number of LEDs (n) becomes large the standard deviation only scales with sqrt(n) instead of n, so normalizing by the output yields a relative (percentage) error on the order of 1/sqrt(n), which gets small as the number of LEDs becomes large. Though this does not take into account correlation in performance among the emitters in the same light.

1 Thank

That’s why I only post relative numbers. :blush:

2 Thanks

That is an impressive DIY setup

2 Thanks

Can somebody explain this part to me? Does it mean that this is the maximum allowable +/- relative deviation from the stated output for any LED emitter of the same model within the same flux bin? How different can LEDs be if they are those installed in the same flashlight model and I imagine purchased in bulk as a batch by the flashlight manufacturer? Would they be likely closer in output to one another or it doesn’t matter?

If we only knew what the ‘true’ value was :⁠-⁠). Calibration to a common standard would make the inter-tester comparisons more meaningful, I think.

Another interesting bit would be the intra-tester comparison: how well the same rig fares depending on light position, time drift, beam shape and the like. Only testers can introduce such QC measures and report them if they wish.

I’d say ±5-10% for the average constant current driver,±20% or more for FET as it heavily depends on quality of solder joints, springs, battery type, battery contact surface pressure…

Add that to the ±7% from the LEDs and you get a huge variation between same models.

Makes sense. But those effects would be more or less random, I imagine. I wonder if the reviews of other lights by the same set of reviewers would confirm that there is a systematic bias involved. If that’s the case, it can probably be reduced by better light integration and calibration, I think.

I dount doubt there is some systamatic error in these measurements, but I’m not sure it’s a problem…

Given a lot of these tests are done as a hobby by people in their spare time, how do you propose improving the integration and calibration without burdensome time or cost demands?

For me, the data actually looks pretty good! If we want “real” calibrated output tests, then commercial laboratories do exist for testing.

Edit to add- I can’t find it now, but there’s a test from a few years ago that reviewer Selfbuilt did where he had 3 identical lights (Sofirn C01S?) and showed the variability between the three… Perhaps someone else can find this test?

1 Thank

Oh no, I have no complaints. I was just curios how uncertain the reported values were to be able to make use of them, so I spot-checked them to understand them better.

As koef3 pointed out, some of the reviews have tremendous reach and influence and the runtime results are treated as gospel by an army of commentators. I kind of needed to remind myself that the uncertainty is as inevitable as death and taxes and needs to be always accounted for.

p.s. This article shows how bias and nonlinearity of a hobby setup can be improved by pooling the data. I think Selfbuit did quite solid job on it - it’s a pleasure to read and follow.

https://flashlightreviews.ca/index.php/methodology/lightbox-design/

1 Thank

I also use a sphere. Calibrated with LEDs of different batches / types and Maukka calibration light. Pretty consistent since I built it.

I don’t want to discuss the measurement methods and setups of other reviewers / influencer. But I think it is good that this topic of possible measurement errors and deviations is brought into the public.

Without opening the can of worms in this thread, I think the premise of “calibrating” lumen spheres/tubes to known or at least the same light source is good, as it reduces the error of the correction factor.

Even a “light box” (I called it the Ulbricht box in 2016, when I started using it) has its drawbacks. From my experience, it is still better than a tube in terms of accuracy with different light sources and beams.

The geometry, for example, is important. There are boxes that have a poorer geometry (high and narrow is not ideal, I achieved the best results with a normal rectangular box). Also the position of the luxmeter/sensor makes a huge (!) difference on how reliable and precise the results are.
The inner coating is important. It should not necessarily be white paper, but a white matt color. There are huge quality differences between different manufacturers, in terms of reflectivity and “whiteness”.

In addition, these boxes produce massive measurement errors if throwers are inserted incorrectly. This is about the angle of incidence of the light on the floor or the side of the box. If this deviates, there are very quickly measurement errors of more than 20-30 percent, which also depends on how and where the sensor is attached. This is in general because more light hits the sensor, it will measure always more as normal. This is not so noticeable with floodlights, but it can still be measured. The concept has worked best for non-directional light sources without secondary optics (mules, LEDs on heatsink). The results were then quite useful and within an acceptable range of inaccuracy.

Yes, this is what they state in their datasheets.

I can say from my own experience, that the tolerance is pretty low in most cases. In most cases (since the chips are more or less identical in electrical specs after binning) the LEDs are pretty close to each other, in flux, Vf and also tint. I tested this with ten XP-E2 of the same reel some years ago. Not the greatest sample size of course, but they were all in a ± 2 % range of flux, although the range in Vf was a little bit higher. I think this depends on the production run, and batches of phosphor, chips and even the wear of the machines used. Maybe also the set thresholds in the binning machine (which uses some sort of sophisticated image recognition or something like this so far I know) have an influence on how huge the range is.

2 Thanks