I will definitely admit to pay any donation or paid version of Ceilingbounce. Thats it is very good and accurate app. This month I tested a lot of my lights with it. It is great so far.
I have a new phone and I’m pleased that I have finally one with a decent ALS, the spectral sensitivity curve (if we can trust the specification) is not worse than most cheap luxmeters and so nowthe luxvalues over different light sources and tints can actually be somewhat trusted and compared. And Ceilingbounce can become useful for me.
Here is the curve for my ALS:

Here is the the Vlamba curve describing the lux, which is what a perfect luxmeter should be:

All my previous phones were much much worse and lux values could by specification neither be accurate or comparable. That said, relative light values were never a problem though, and that is what most people use Ceilingbounce for (i.e. runtime/output recordings)
There’s no paid version. It’s open source.
Maybe if I rewrite it using dev tools that aren’t abandonware and add some features, I’ll set up a tip jar or something. Thanks for the offer.
Yes I talked for new paid version or similar of ceilingbounce app and new features. I think many BLF users will buy it. You can create something like interesting list about that to see if its worth development of it.
This app is a gem: simple, functional and a joy to use. Kuddos to @zak.wilson for writing it and then sharing it with the world! Opensource rocks!
I'm using it on a little project of mine to estimate battery capacity using just the initial tailcap amps from a flashlight plus the relative luminosity values from the CSV file.
Regarding that, I have a question: in what order is the CSV file written? I see it's almost entirely ordered by the 2nd CSV field (minutes), but I'm seeing one line out-of-order, usually the first line, but sometimes the second:
test1-84168495926797.csv
398.18253,0.50090444,100.0
177.99751,9.020755E-4,44.70249
330.4125,0.01757856,82.98016
test2-83141583950210.csv:
352.755,0.50120795,100.0
167.7375,0.0012484037,47.55071
378.0,0.017892987,107.156525
test3-107531973484759.csv:
1597.05,0.0012127951,101.842285
1568.16,0.50120896,100
1599.2776,0.017876647,101.98434
The "out of order" line (which I marked in bold in each example above) is always repeated exactly further on in each file, and always as line #32.
I would have said it's just a "header" line containing the measurement for the 30s "100%" relative value (to ease things for programs so that they will know it in advance?), but then example #3 above breaks that rule.
Can @zak.wilson or anyone please shine a light (pun intended ) on this?
Thanks in advance!
I personally use another light for the first 10 seconds and then drop in the test light. I then use google sheets for my graphs.
So you discard that supposed ‘header’ line, along with everything else before that 10 second flashlight swap, correct?
Yes, that’s correct. It was messing my graph up for awhile until I noticed. It could be what determines the 100% value for the graph
(swap! lux-30s identity* @common/lux) ; start the graph with this, update later
In English, this means it’s meant to start the CSV with the 30-second reading. I’ve never seen it start the file with another line and put the 30-second reading on the second. That’s a bug, and probably a device-dependent one. I’m not going to fix it or make any other updates to Ceilingbounce as we know it as the devtools used to build this thing are no longer maintained and it would be a huge amount of work to figure out how to compile it today.
I may consider a rewrite at some point, but there’s another issue: many newer phones often have weird light sensor behavior, only updating when there’s a large change. They do seem to be able to be precise, but that’s only useful if there’s a way to force a read and I’m not sure there is.
Thank you for the confirmation! I can’t discard the first 10 secs as that would impact what I’m trying to do, but I will discard just that line, that’s easy and literally zero impact. I just wanted to confirm that would be the right thing to do!
Thanks for the explanation. I know nothing of Clojure but tried having a look at the source and of course couldn’t tell heads from tails. And some people say PERL is cryptic! ![]()
Totally understandable!
Please don’t bother, your app is fantastic as it is! I just hope Google doesn’t f* things around enough to break it (it has done that with some other apps I use), then a rewrite would be very much appreciated.
So you are that Zak! Thanks for your reviews, I love reading them.
They’ll probably break it eventually. They’re increasingly restricting filesystem access (a good thing for security and privacy in some cases), and Ceilingbounce acts more like a desktop app, expecting access to a specific filesystem location without jumping through hoops beyond the basic files permission.
I have a problem when trying to create a graph in Excel.
Up until now, I used to:
- import the CSV file into Excel
- replace the first few cells in the time column with “00:00:00, 00:00:01, 00:00:02” and so on
- let Excel auto-fill the rest, knowing that the App takes a measurment every second
Up until recently this used to work great.
But yesterday, I realized that there is a fatal flaw to my technique.
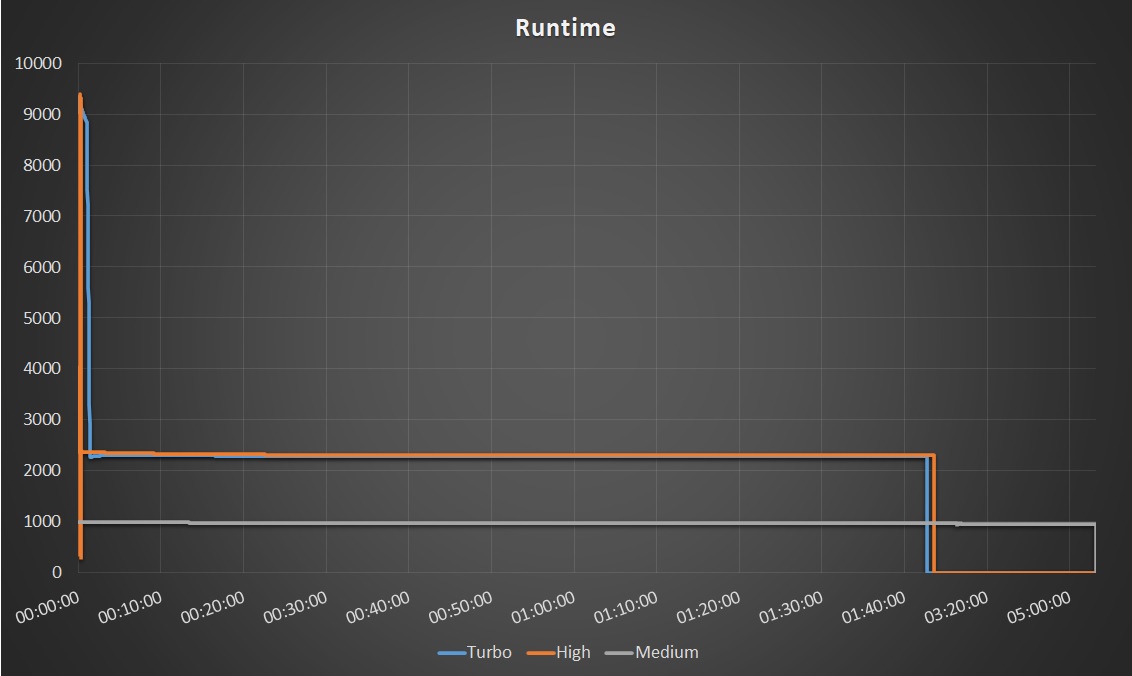
I didn’t know that after 100 minutes, the app takes a measurment every 10 seconds. Therefore, my graphs in Excel would get squished 10x beyond the 100 minute mark.
I only realized this after uploading a 5 hour runtime, only for it to show up to be 2 hours and 10 minutes.
Right now, even if I autofill the time to 100 minutes and then autofill again correctly after 100 minutes, the runtimes are still squished, but with the correct time on the bottom.
I tried different ways to approach this problem but I can’t find a solution.
What’s a good way to create runtime graphs from a CSV file? A video of the process would be much appriciated.
Sadly, the themeplates shared by @spoonrobot in the #57 reply don’t work anymore.
If your goal is to show the X axis as hh:mm:ss instead of decimal minutes, divide by 1440 and format as time.
This succesfully converted the CSV time information into something that Excel can digest, but sadly Excel still gives the same amount of spaceing between all measurments, not accounting for the more spaced out measuring frequency after 100 minutes.

I didn’t manage to find a setting that would format the X axis to have correct spacing.
I could visualise my current problem like this:
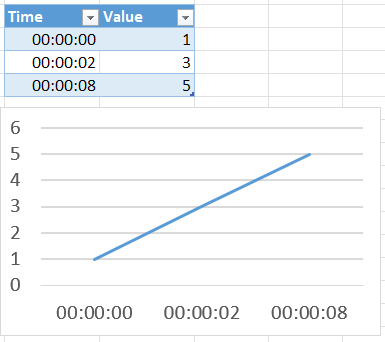
It shows a linear growth of the value, even though there’s a much bigger difference between 0s-2s vs 2s-8s.
I don’t actually use Excel, so I don’t have specific suggestions. It seems like it should be able to space each axis according to the actual values, or to get the value from one column and the label from another.
I think you have the wrong diagram type. You should use x-y-scatter, then the x-distances will be correct.
I don’t use Excel either, just Google sheets. However I was a pretty involved Excel jockey a few years ago at work. I hope this is clear, it took me a little bit to remember and research this response.
I think the issue is how Excel sees Time as a set of Values or as Clock Time.
This is how Excel sees Clock Time:
In Excel’s internal system:
- 00:00:00 is stored as 0.0
- 23:59:59 is stored as 0.99999
- 06:00 AM is 0.25
- 12:00 PM is 0.5
So by formatting in the way you have done, it will not be read correctly since the Ceiling Bounce app outputs time as a decimal no matter the interval. Excel is seeing your data at clock time, not duration.
You are telling Excel you want to graph time that goes from 1:40am to 3:08am but has the same amount of minutes as 1:30am to 1:40am. If that makes sense.
For example, this is the minute #1 to minute #2. It is 1 minute divided into 60 data points expressed as decimal notation.
1.0043572
1.021019
1.0376883
1.0543466
1.0710235
1.0876896
1.1043569
1.1210217
1.137679
1.1543566
1.1710222
1.1876762
1.2043555
1.221024
1.2376924
1.254357
1.2710235
1.287691
1.3043554
1.321028
1.3376884
1.3543458
1.3710243
1.3876889
1.4043548
1.4210236
1.4376879
1.454357
1.4710251
1.4876863
1.5043564
1.5210184
1.5376871
1.5543617
1.5710232
1.5876814
1.604357
1.6210246
1.637689
1.654355
1.6710213
1.6876794
1.7043556
1.7210194
1.737673
1.7543607
1.7710166
1.787689
1.8043526
1.8210173
1.8376894
1.8543465
1.8710107
1.887682
1.90435
1.921015
1.9376819
1.9543505
1.9710212
1.9876809
When you change the format as you have done you are not changing to duration in HH:MM:SS - you are changing it to the format for 12h/24h Clock Time. Which is why the spacing is incorrect. Each data point of 60 seconds was 1 minute, when the sampling interval changes, now each data point of 60 seconds is seen by Excel as ~10 minutes.
As zak.wilson noted above, I think the proper solution is as follows:
- Divide each value in the entire set of time data by 1440 and then change the format to Duration. This will display each time point as strictly HH:MM:SS Duration without moving into the Excel clock formatting. When you create your chart this will show the correct interval and spacing for your chart. Each second is a second and each minute will be a minute.
Here is a share sheet from Google Sheets that shows both the decimal time directly from the app and the conversion charted. As noted all I did to get the chart to correctly display the proper interval for Hours and Minutes greater than 1h40m was divide by 1440 and then change format to Duration:
I avoided this issue when I did all my runtimes but it would have been much better to confront it then and have my charts read hours/minutes instead of just minutes. Oh well, always learning and improving.
I hope this helps.
2 Thanks
Thank you very much for this explanation. I think I mostly got it to work.
I used the XY Scatter instead of the 2-D Line graph and that solved the issue with badly spaced X axis.
But with the XY Scatter I run into another… misunderstanding.
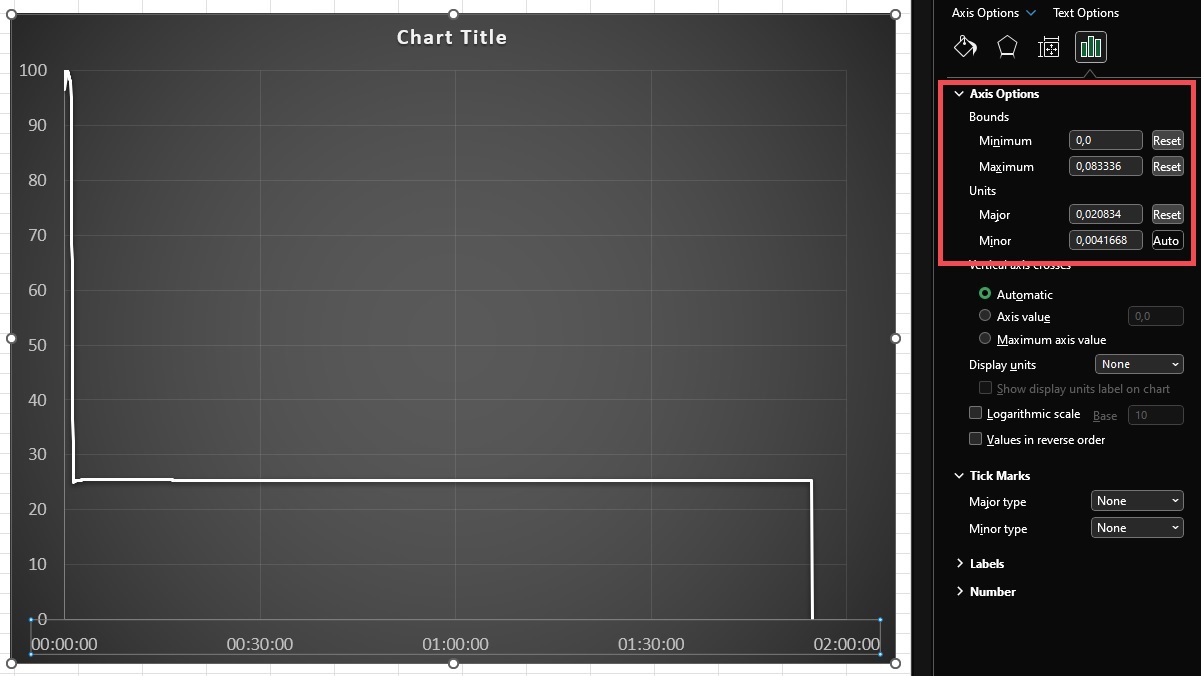
Are my Bounds supposed to have such bizzare values?
This makes it quite a bit more difficult to set the units, I need to bruteforce and guess the right value until it’s correct.
I did format the Time column as duration ( [h}:mm:ss ).
Here’s how the graph looks like if I leave the Axis Options settings at default:
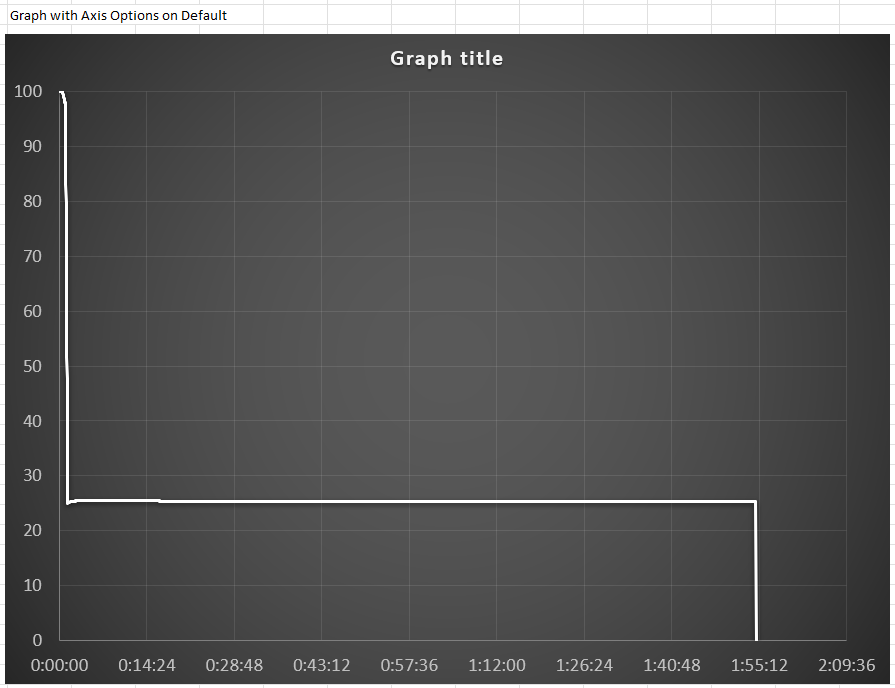
Your bound values are minutes/1440
For example your Units: Major is 0.020834 * 1440 = 30 minutes
Etc.
There might be a way to correct this automatically but something like this I’d make a table and enter manually. You should only have to do this once for template and adjust for very long or short runtimes.
| Minutes | Decimal/1440 |
|---|---|
| 30 | 0.0208333 |
| 60 | 0.0416667 |
| 90 | 0.0625000 |
| 120 | 0.0833333 |
| 180 | 0.1250000 |
| 240 | 0.1666667 |
| 300 | 0.2083333 |
1 Thank
Hey thanks for the awesome app Zak. I just got out an old xioami phone and built an integrating rotary tool box. Got it calibrated with a known light and it’s working well. Some surprises for sure. One question though. I’ve added the ratio in the lumens section to get consistent and mostly accurate results. But in the graph section, I believe the numbers are still without the ratio applied. So if the light is 200 lumens, it’ll show 700. Is this right and the graph area is just to show relative to 100% and not accurate lumen readings? Thanks