I have developed a tool to calculate the resulting spectrum when combining various light sources with different spectra. Naturally, the modeling tool is primarily designed to work with LED spectra.
The idea for the tool arose while refining my tool for digitizing LED spectra from datasheet screenshots.
Below is an image of the main interface of the LED spectrum simulator. As with the first tool, I will use non-standard Bridgelux Thrive LEDs as an example. The spectrum was simulated using 4 distinct LED channels: two channels consisting of Thrive 5000K (100 units) and 3000K (50 units), plus Osram 660 nm and 730 nm at 3 units each.
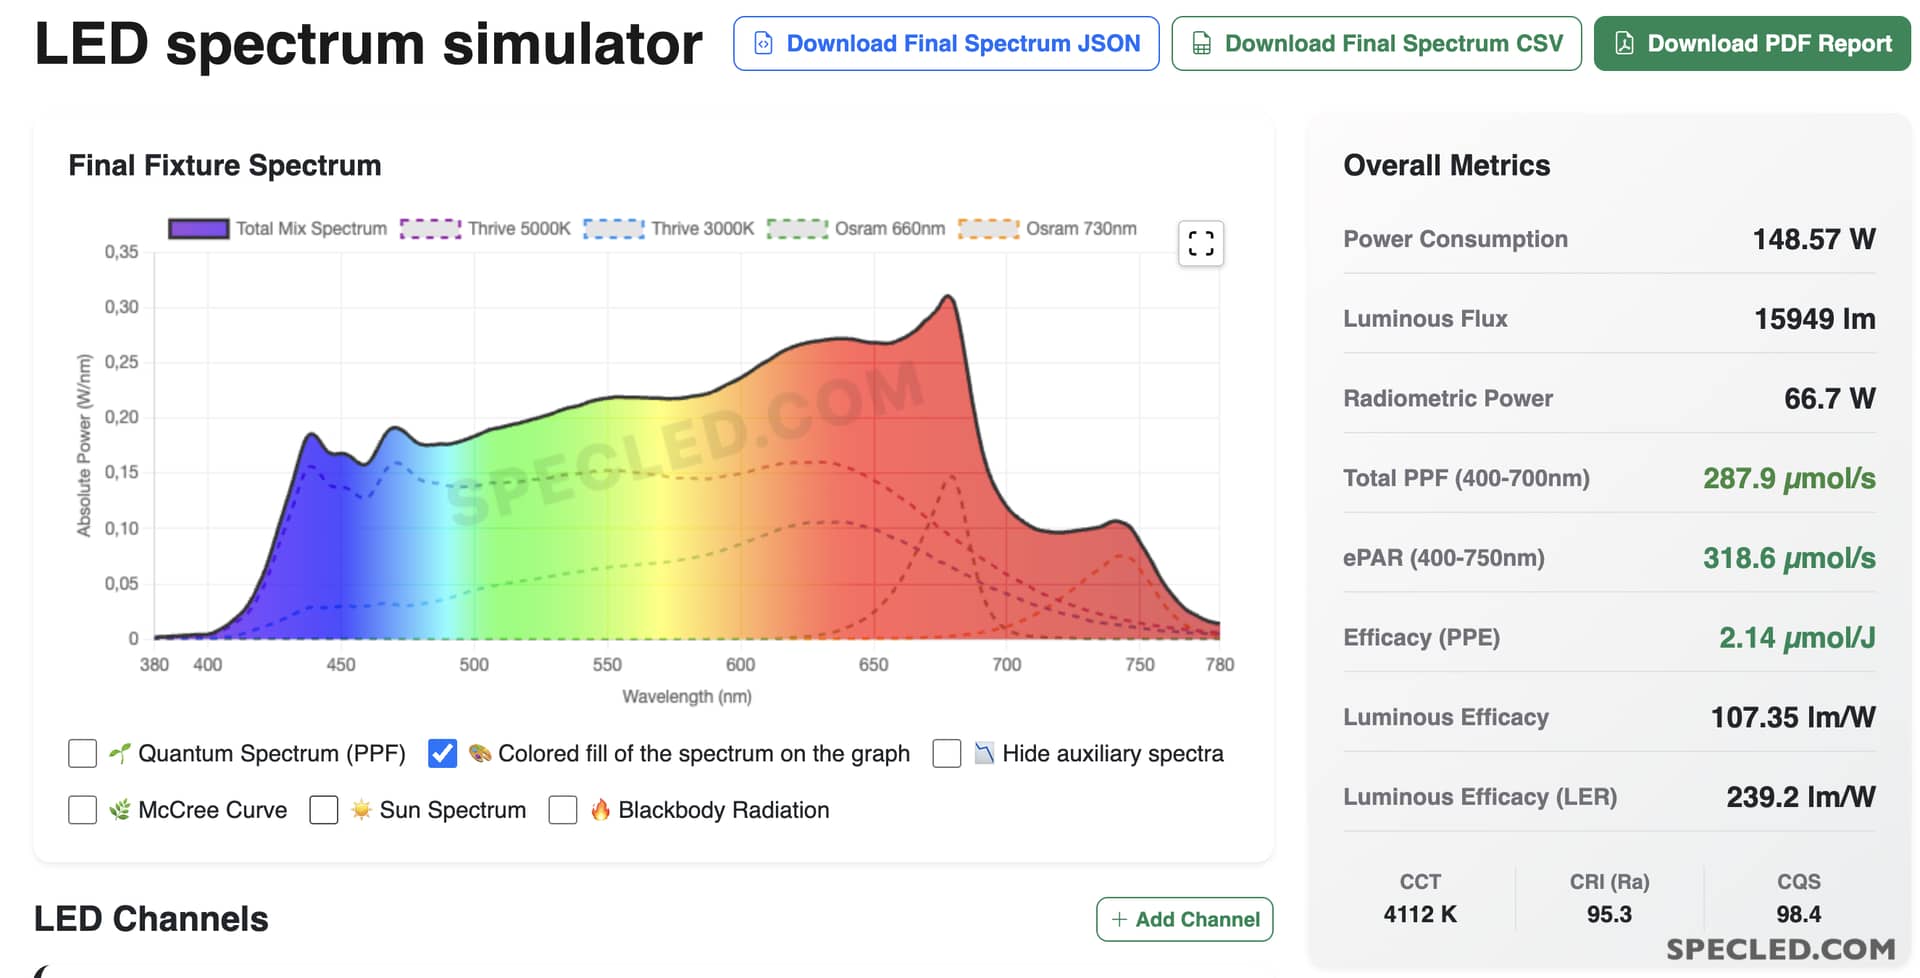
A key feature of the spectrum simulator is the ability to switch the spectrum display between the radiant and quantum spectra. This allows the spectrum simulator to be used for designing specialized plant lighting.
The maximum number of channels available for calculation is 15.
To obtain the digitized spectrum of an LED or other light source, the first step is to use the LED spectrum digitization tool.
Next, for convenience, you can include the key LED parameters directly in the JSON or CSV file name. This is very convenient for subsequent work. It eliminates the need to repeatedly check the documentation and manually enter parameters. The parser is configured for parameters such as V, mA, Lm, PPF, or mW.
Let’s break down the file name Thrive_5000K_9.1V_100mA_108Lm.json:
- Thrive_5000K - an arbitrary name, convenient for indicating the LED type and its color temperature or wavelength;
- _9.1V - forward voltage drop of a single LED (for Thrive LEDs this is 9.1 volts);
- _100mA - rated forward current of the LED according to the datasheet;
- _108Lm - luminous flux of the LED according to the datasheet at the rated current (100mA). You can also specify the radiant power in mW or the number of emitted photons in PPF. The script will automatically recalculate any of the specified parameters.
From there, the parser works its magic and automatically maps all the specified parameters into the appropriate fields. All you have to do is set the actual operating current for the LED in the designed LED module and the number of LEDs in the channel.
Main parameters calculated by the LED spectrum simulator:
-
For each added channel, total power, PPF, and lumens are calculated separately.
-
Color temperature of the resulting spectrum.
-
Color rendering index CRI, CQS.
-
Total power of all channels.
-
Total luminous flux in lumens.
-
Total PPF and PPE.
-
Average luminous efficacy in lm/W.
-
LER value.
-
Circadian metrics.
-
Breakdown of the spectrum by ePAR ranges.
-
Chromaticity diagram and deviation from the Planckian curve.
Additionally, the spectrum can be colorized, compared with the McCree curve, compared with the solar spectrum, or compared with the blackbody spectrum.
After configuring the spectrum display, a full report in PDF format is available for download.
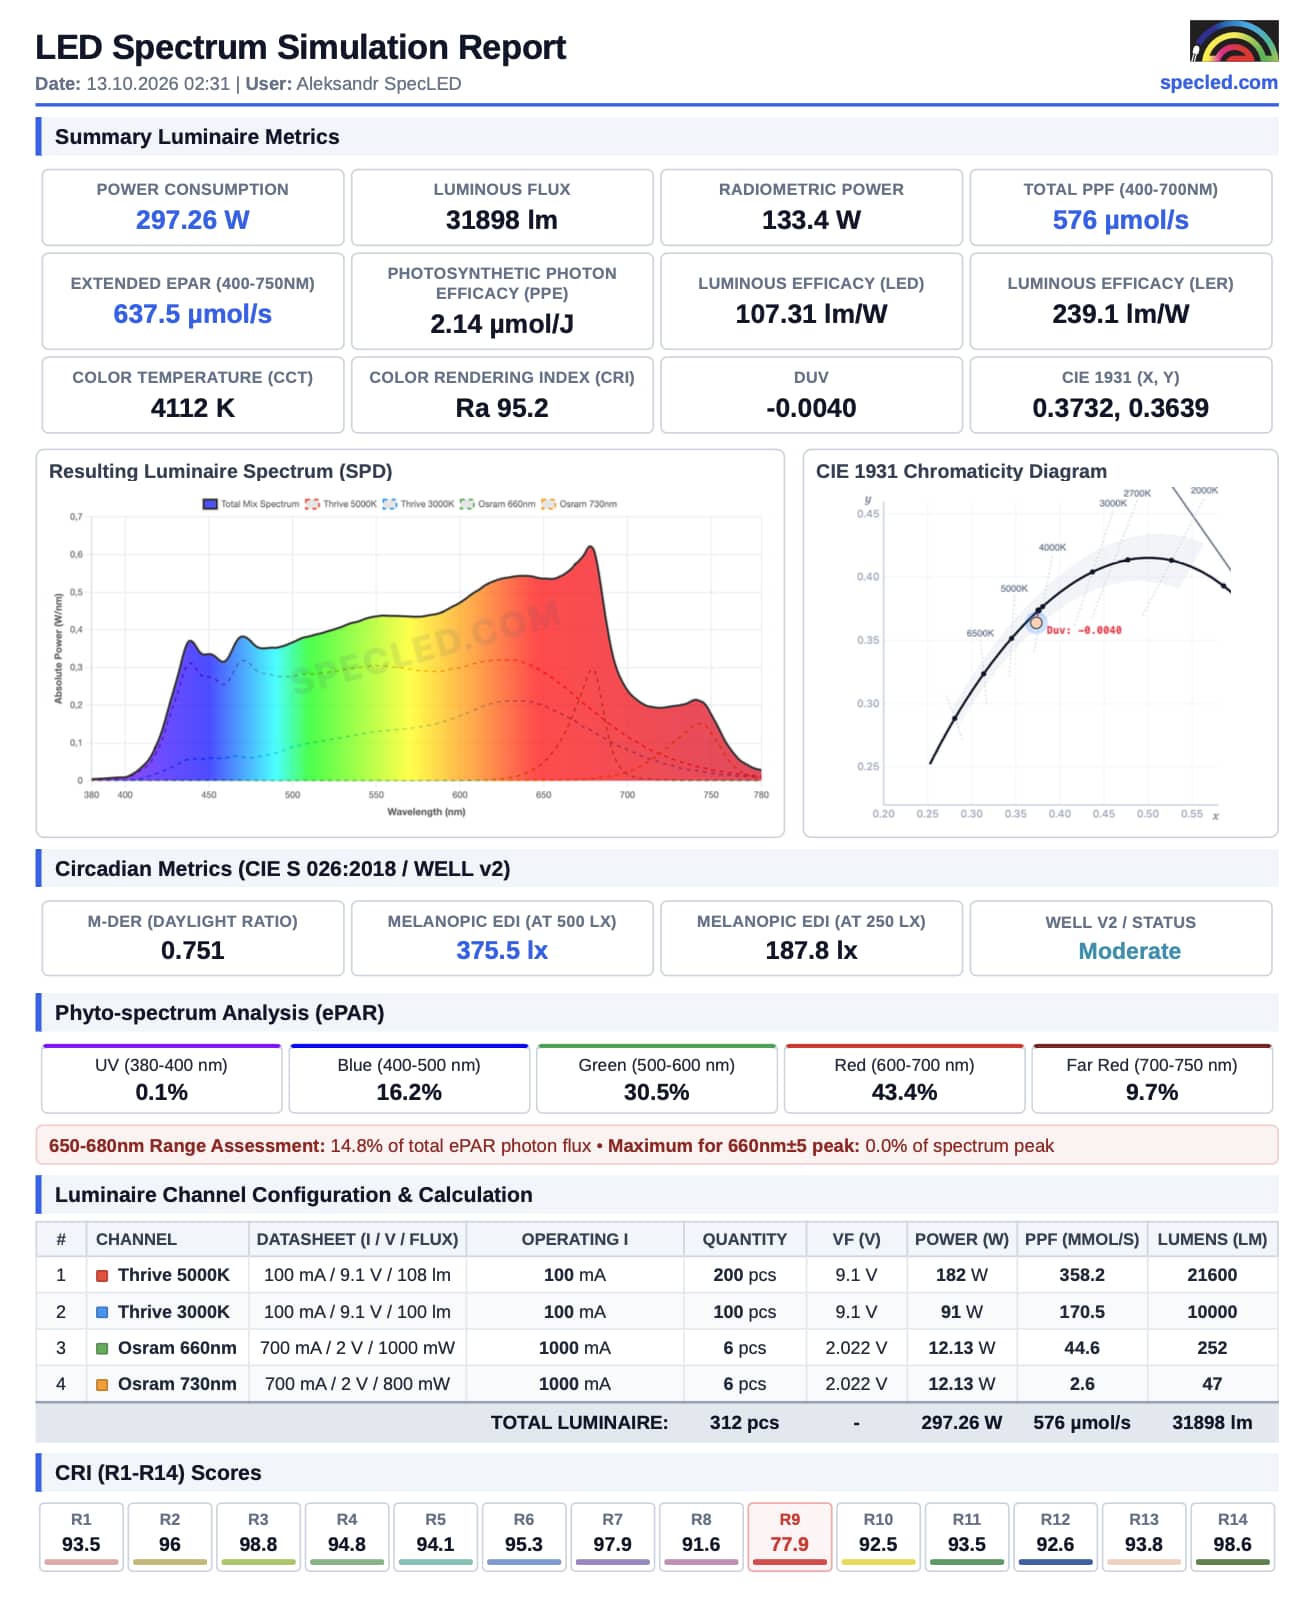
The resulting spectrum can also be exported in JSON or CSV format. You can then return to the spectrum digitizer tool to calculate color rendition metrics according to the IES TM-30 standard.