Opple Light Master 4 discussion thread (new 2023 model)

And i see they are even $20 right now…(sighs and digs out credit card).

It has been discussed before but i just want to make sure. Current LM4s used through the mobile app can (eventually) and likely will, be updated to be more accurate based upon your efforts?

I see we can use this app, which is AWESOME btw, but i would also want to ensure that Android use would also be updated as well

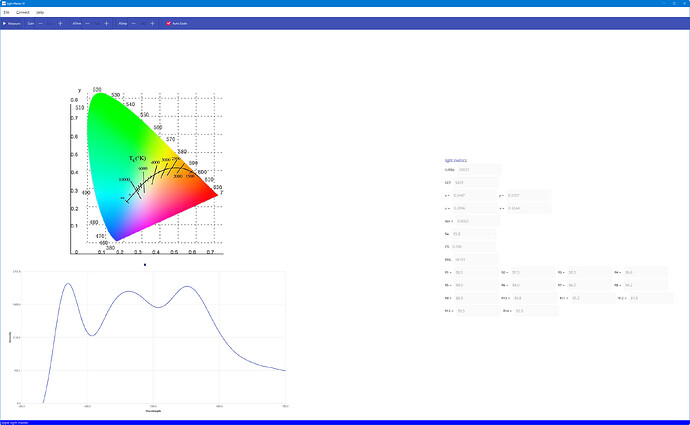
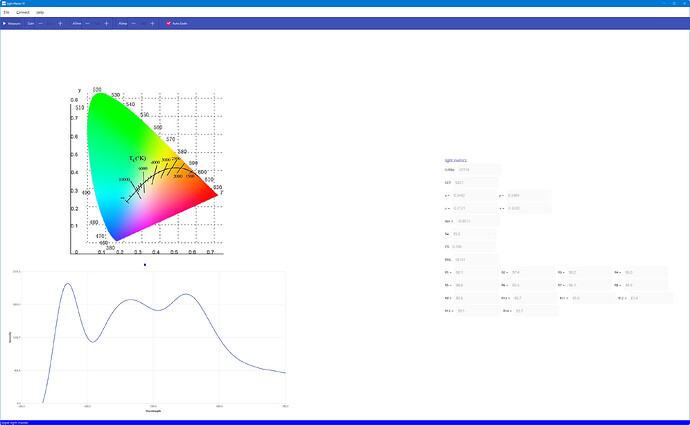
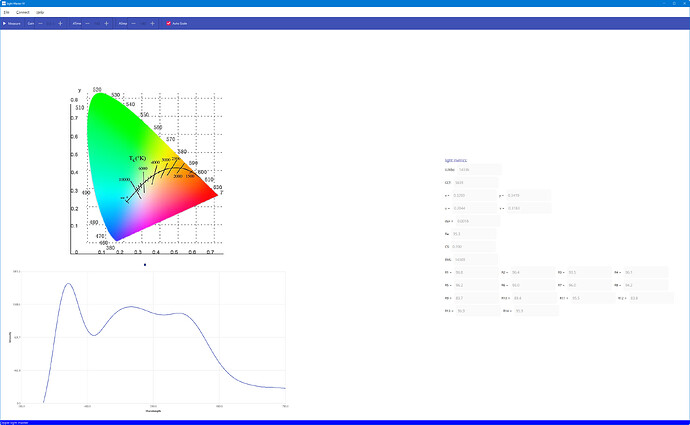
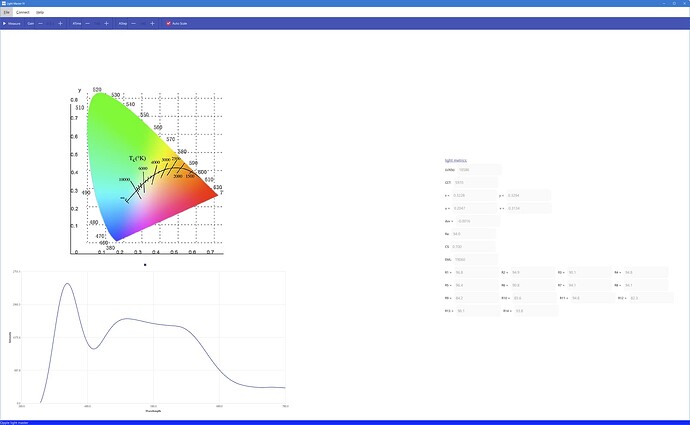
I took some measurements with the lights I have at the moment.

Wurkkos COB, CCT: 5697, duv: 0.0017, Ra: 68.5, R9: -16.6

Nitecore TINI2, CCT: 5699, duv: 0.0003, Ra: 73.1, R9: -7.8

Emisar D1 mini Nichia B35AM 5000K (at output 4/7)
CCT: 5029, duv: 0.0022, Ra: 95.8, R9: 88.9

Emisar D1 mini Nichia B35AM 5000K (at output 7/7)
CCT: 5027, duv: -0.0013, Ra: 95.6, R9: 90.6

Wurkkos T10 LatticePower CSP2323 6000K (at output 4/7)
CCT: 5637, duv: 0.0018, Ra: 95.3, R9: 83.7

Wurkkos T10 LatticePower CSP2323 6000K (at output 7/7)
CCT: 5970, duv: -0.0016, Ra: 94.0, R9: 84.2

Here are all the measurements with my comments as footnotes.
Wurkkos COB
CCT: 5697
duv: 0.0017
Ra: 68.5
R9: -16.6 [1]

Nitecore TINI2
CCT: 5699
duv: 0.0003
Ra: 73.1
R9: -7.8 [1]

Emisar D1 mini Nichia B35AM 5000K (at output 4/7)
CCT: 5029
duv: 0.0022
Ra: 95.8
R9: 88.9 [2]

Emisar D1 mini Nichia B35AM 5000K (at output 7/7)
CCT: 5027
duv: -0.0013
Ra: 95.6
R9: 90.6 [2]

Wurkkos T10 LatticePower CSP2323 6000K (at output 4/7)
CCT: 5637
duv: 0.0018
Ra: 95.3
R9: 83.7 [3]

Wurkkos T10 LatticePower CSP2323 6000K (at output 7/7)
CCT: 5970
duv: -0.0016
Ra: 94.0
R9: 84.2 [3]

Comments on the measurements:
[1] High CCT, low R9 LEDs are now displayed at the reasonable ranges.
[2] The R9 for Nichia B35AM seems to be in the correct range. However, there is a hump around 640nm in the spectral density graph. I do not see such a hump in the Nichia’s spec sheet (see p.29) Edit: The density on p.29 is for 5000K R8000 which is not what is measured (my LED is 5000K R9080). I see the hump in p.30 (5700K R9080). Also the hump can be seen in the review by Zeroair although it is for 4500K R9080 LED. I guess the hump is typical for R9080 in the CCT range.
[3] For the LatticePower CSP2323 6000K, R9 seems to be high compared to koef3’s R9 measurement of 67. See here for koef3’s review on the same LED.

Other comments on the app:
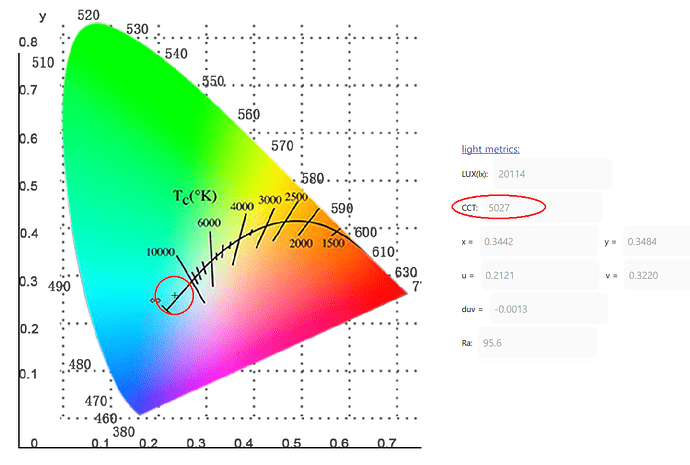
[1] The crosshair mark on the chromaticity coordinate system is misplaced. My leds’ CCTs are around 5000K, but they are displayed as having CCTs over 10,000 on the displayed x, y coordinates. I am using a 4K monitor and changes in the layout due to screen resoultions could be causing this. I hope the layout can be improved in the next version.
[2] I hope there is a real-time measurement option. I was adjusting the distance from my LM4 to my lights so that the lux is around the same range. However, the LM4 only updates the numbers when I hit the “Measure” button in the app. Also, the measurement is very slow compared to the Android app. If calculating certain measurements takes time, I would recommend not displaying them, but displaying what you can in real time.
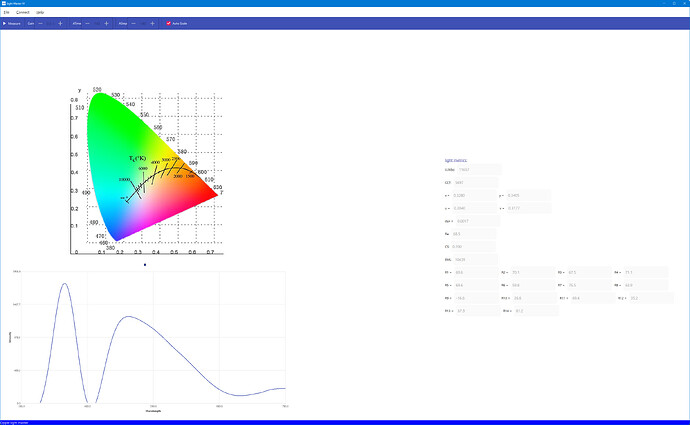
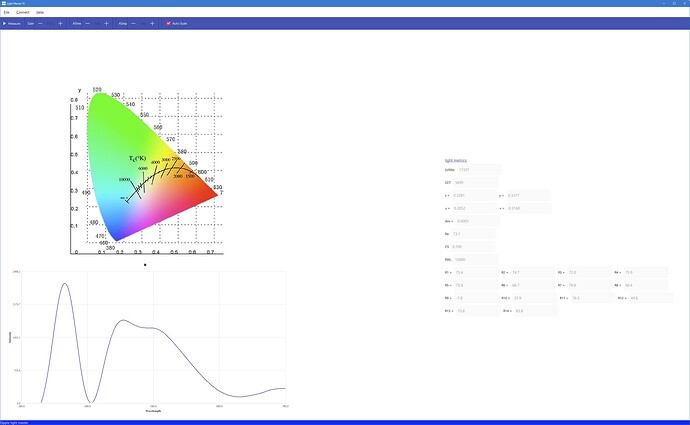
seems your UI is totally distorted, thank you for you review.
I think for PC software if the measurement is in real time looks weirdly.

Does anyone know the current state of LM4 measuring CCT values and x,y coordinates? Is it reliable?

It’s nice to see you, qasd00!

a lot of tests done by others, refer to posts before.
the windows app utilizes XYZ calibration to calculate CCT and x,y coordinates and duv currently.
there is alternative way to calculate them, but I currently prefer XYZ way.

I think displaying real-time measurement and adding an option to pause (or take average for a short time) is much better solution.

Additionally, the measurement takes way longer than expected. In Android app, you get the measurement almost instantly, but in the Windows app, it takes more than 3 seconds for the results to appear after I click the ‘Measure’ button. Weirdly, it takes much less time when I take measurements for the first few times, but it takes much longer after a few measurements.

Also, I would like to add more detail on the graph mentioned in my previous comment.


The image above, circled in red, shows what I mean by the incorrect crosshair mark. The measurement is around 5,000K, but the graph shows above 10,000K. If you look at all the screenshots in this post (including yours), the crosshair marks in the graphs are incorrectly displayed. This issue was mentioned multiple times, and your replies seem to regard it as a layout problem due to screen resolution differences. However, it is not, because your screenshot has the same problem.

1 Thank

got it

1 Thank

For what its worth I just ordered the LM4 because of what you have done here.

Excited to give it a try…even if i rarely use my LM3…

5 Thanks

I hope June 11th or later I could upload Android/iOS app to google drive.
the official release perhaps would be delayed to around November(product manager has their plans). really not easy to do things in a big org. I am not good at communicating with other people, especially those with a totally different background.

6 Thanks

Hi guys I need your advice.
I do brightness (mostly) testing of LED bulbs and i faced the limitation of 50000lux in brightness measurements.
I thought I could use some neutral filter to reduce brightness for light source, but the only neutral filter film I found on Aliexpress is very differently influence on LED and halogen bulb lights. The measurements does not looks correct, it seems that this neutral filter film blocks only specific wavelength or do it not evenly for the spectrum.
Do you have any ideas how can I reduce lightsource brightness or block light intensity somehow in order to do test bright bulbs?
May be some neutral filters exist for the LM4?
Thanks.

There are neutral density filters (for cameras) on Amazon and AliExpress that could be used.

Some ND filters can be adjusted by rotating them while others are fixed (e.g. ND16).

1 Thank

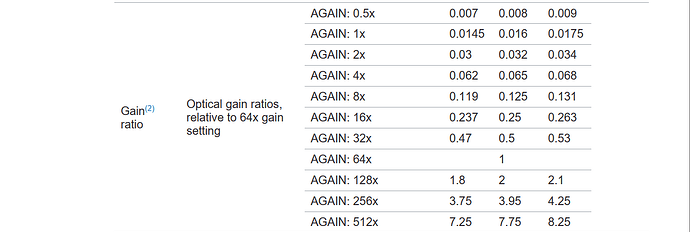
this is related to the “auto gain” mechanism, when light is strong, the chip should use a smaller gain value to avoid saturation, while light is weak, the chip should use a bigger gain value to elevate precision. actually from the firmware side, it’s already done. but 1. we have to modify the protocol, 2.no resources to measure the real ratio values.
the chip supports gain ratio as in below graph:

2 Thanks

how about the crosshair painted? acceptable?

This is why I choose to buy ND filter film on AliExpress. But I think the problem with fim quality as it reduces the light intensity for halogen - 3 times and LED (one of the testing subject) almost 100times!, that is why i have doubts about equality of wavelength filtering.
I choose the film filter over other types of filter as I can easily install and change the shape of the filter comparing to glass filters which impossible to use due to it’s size and form.
Is there anybody have an experience with using ND filters with LM4? does glass filters works good?
Is there any other way how to equally reduce brightness for the spectre or solve the issue how to measure brightness of the high brightness source?

Two questions Steve:

  1. is there any chance that LM4 could measure Lux over 50000 in future?
  2. at what Lux level measurements of color temperature and R9 will be more accurate from LM4 point of view?

Is there a reason it needs to support over 50K lux? I just hold the flashlight back farther. Does that make it less accurate?

yes, there is the reason. I have a test stand with “light globe” where i measuring in the equal conditions led bulbs, and i faced the limit 50k Lux. I need to find a way to overcome it.

1.It can be done, but not easy.
2.“auto gain” mechanism is important, it can elevate low lux environment measurement accuracy. and it can avoid saturation in high lux environment.

but it is not easy to implement it now. takes a lot of efforts.

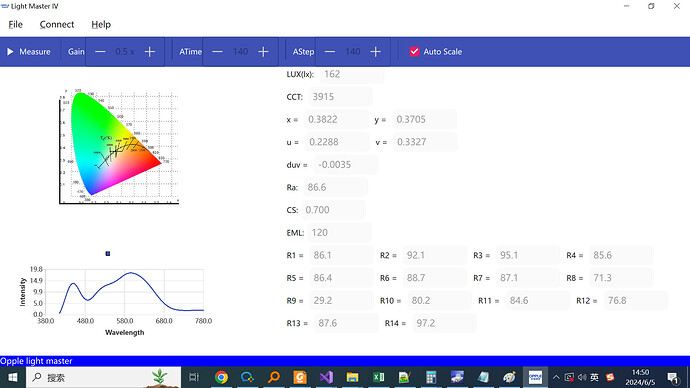
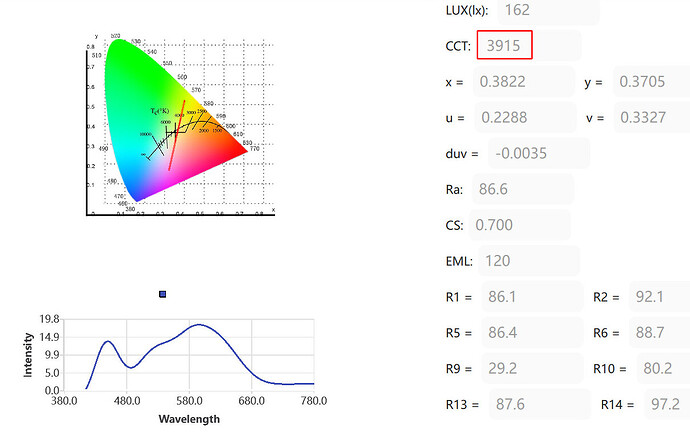
It is much better than before. However, it is still inaccurate.

The CCT is 3915, which means the cross-hair should appear on the right of the red line (the 4000K line). In the graph above, the crosshair mark is on the left.

I suggest you look into javascript files in the waveformlighting.com duv calculation webpage.

See lines 2077-2101 in the page source code.

I think two javascript files Chart.min.js and cie.js contain all the necessary codes to draw a correct graph.

1 Thank