Would it be possible to also include the LER in the original digitizer tool? I think it is super helpful, and would like to run some tests.
The spectrum mixer tool looks very promising, especially with the feature to read datasheet specs.
Would it be possible to also include the LER in the original digitizer tool? I think it is super helpful, and would like to run some tests.
The spectrum mixer tool looks very promising, especially with the feature to read datasheet specs.
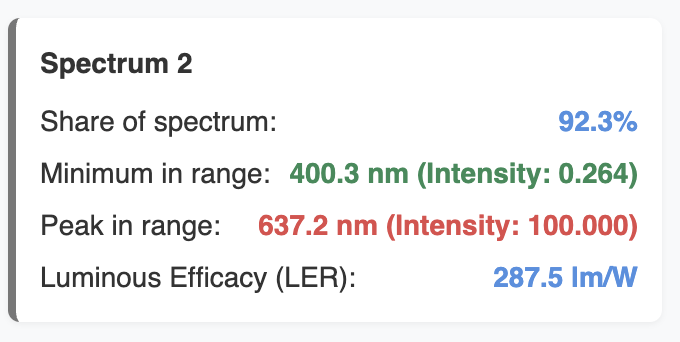
I’ve added this parameter; it is displayed in the first block.
Could you tell me more about the filters? Do you mean that it should be possible to upload the filter’s spectrum and see the resulting spectrum after applying it?
Thank you very much! I tested it against some spectra of known LER and can confirm it is accurate.
Yes, that is what I mean! The filter’s transmission spectrum T(L) is essentially a list of percentages per wavelength, i.e., T(L)% of the light is transmitted at L nanometers. So multiplying it to an emission spectrum results in the filtered spectrum. All you need to do is enable numerical multiplication of two spectra.
Thanks for trying it out.
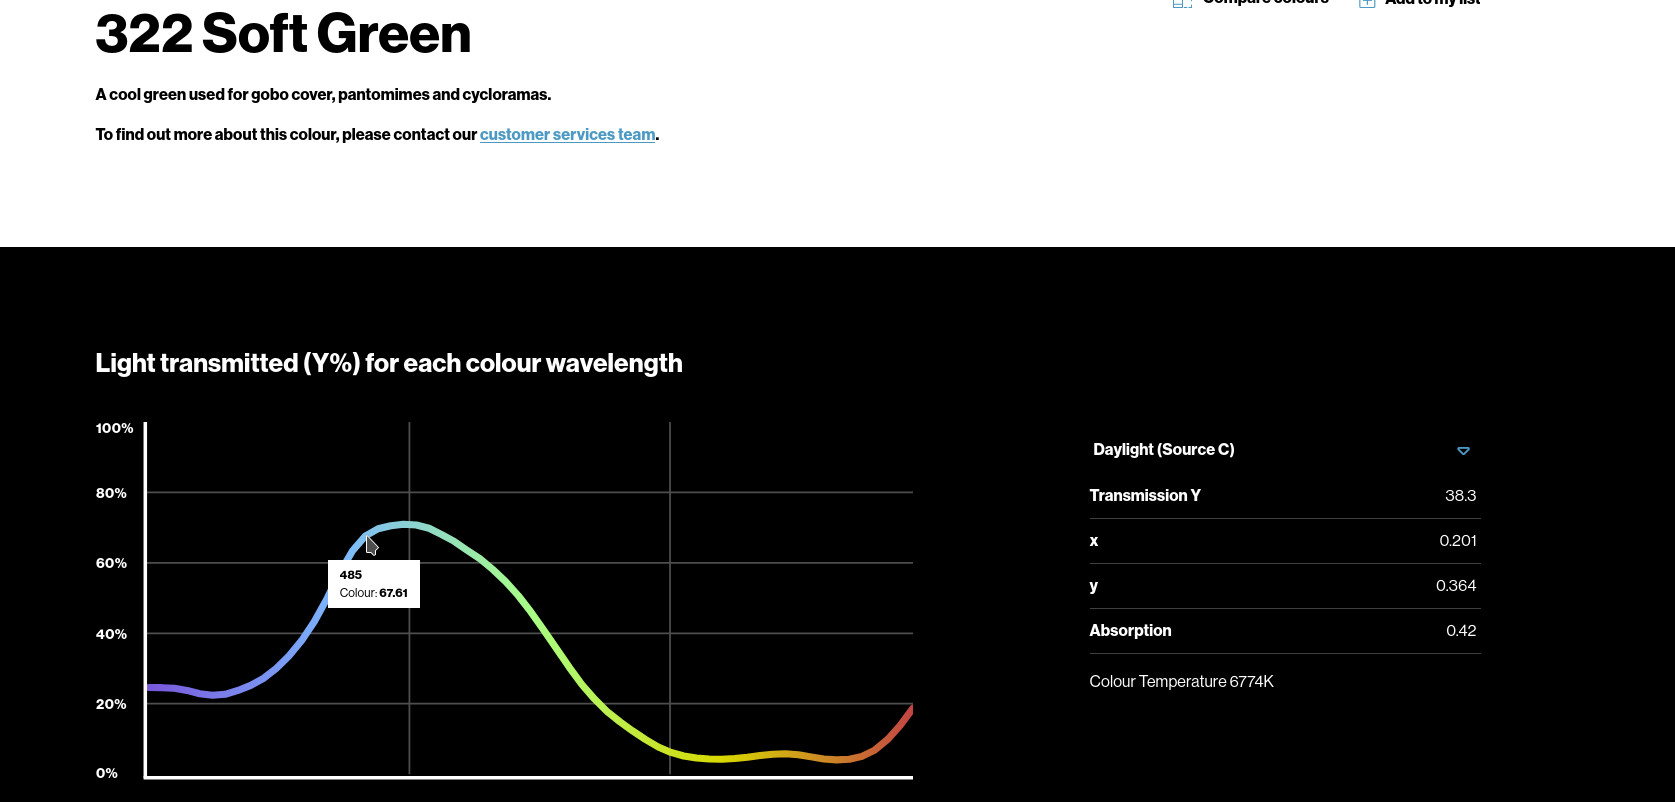
The source data comes from https://leefilters.com/colour
This is how I got the idea.
For me, CFLs and some metal halide lamps are notoriously bad, even if the CCT is acceptable, so I was looking at some example spectra and data from these lamps. Even some high-pressure sodium lamps can get up to a CRI of 85.
Loosely inspired by the spiky CFL spectra, I tried to recreate something similar myself.
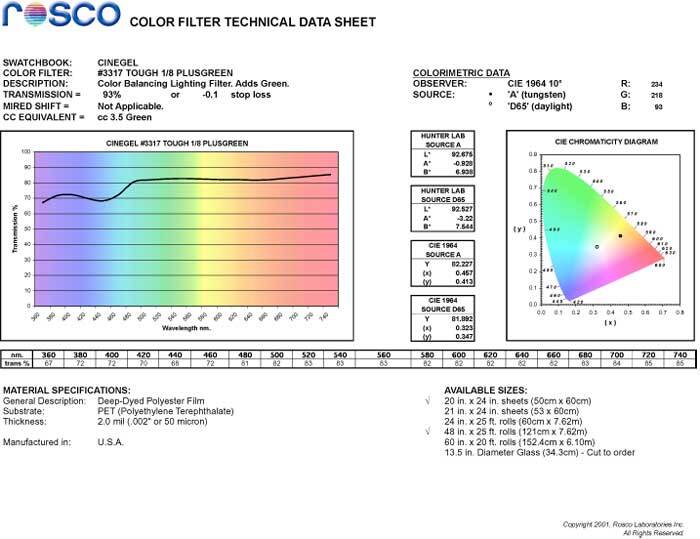
the filters can be sourced from companys like LEE or Rosco
LEE data can be extracted from the website, and Rosco data can be obtained from their app.
The filter goes in front of the LED to correct or modify the light—for example, to change the Duv, CCT, or color.
Of course, the filter removes some unwanted wavelengths, and this way wastes energy.
It would be useful to calculate what percentage of the lumens, or perceived brightness, the filter is absorbing, as well as what percentage of the light from the LED it is actually absorbing.
These are not the same thing: one is photometric absorption, while the other is radiometric absorption.
I’m getting a 404–Page Not Found. Any chance you could share a printout of the page?
Thanks for the printout. In lieu of the broken link above, here is the correct link to the filter catalogue and their spectra: Colour Gels for Lighting | LEE Filters
This is quite an interesting topic overall. Would a tool that calculates the resulting spectrum after applying a filter be useful?
I think it would be worth developing a separate tool for this, with all the relevant metrics included.
The same tool that can be used to “add” multiple LED Spectra together can be used to “subtract” filter
As @QReciprocity42 said.
The “subtraction” is actually a multiplication with a value from 0 to 1
I would say so.
In addition to what color , Duv,cct,CRI,tm30 and so the resulting “filtered” light has
My biggest questions would be. How mush Light from this specific LED gets absorbed in the filter.
How many lumens i’m losing from this.
(both can be a very different thing!)
Why it would be useful?
High CCT led can be converted to a Low CCT on or a Green one to a rosy one… but at waht cost of output
see
I agree that an answer to this question would be a useful piece of info for any filter.
I think the question is best posed as: given an emission spectrum and a filter transmission spectrum, what percentage of lumens does the filter retain/lose? Percentages are the natural quantity to work with because it’s scale-invariant and does not depend on the absolute output of the emitter, which is a piece of information not available from the spectrum.
The way to calculate this retention is well within the existing machinery. Let f(L) denote the spectrum, T(L) the transmission percentage of the filter, and V(L) the human-eye luminosity function. The luminous transmission efficiency of the filter is given by
∫ f(L)T(L)V(L) dL / ∫ f(L)V(L) dL.
This quantity does not depend on the scaling of the emission spectrum f(L), and is thus well-defined from just knowing the spectrum, without knowing the absolute brightness.
Here’s another project idea that I’m interested in, which automatically becomes feasible once multiplication of spectra is implemented. Most people would probably find it uninteresting, but I’m going to throw it out there anyways just for fun.
For context: it is known that under low-light conditions, the human eye switches from photopic (daytime-adjusted) to scotopic (dark-adjusted) vision. Under the scotopic regime, the brightness of different wavelengths is weighted differently. As a result, the eye’s color perception is best described by the scotopic luminosity function, which is quite different from the usual (photopic) luminosity function; a comparison between them can be found in the graphic on this page.
The associated shift in color perception is known as the Purkinje Effect. A 100CRI 5000K light that looks neutral and colorful during the day may seem blue-grey and unpleasant under scotopic vision. This is the reason behind the Kruithof curve, which describes the general preference for lower CCT in low-light conditions, and higher CCT in high intensity. So it is natural to wonder: what is the perceived CCT and CRI of a light source under scotopic vision?
Clearly, the usual notion of CRI does not work, per the example above. In order for a spectrum f(L) to be perceived as 100CRI under scotopic vision, the product f(L)S(L)–which represents the perceived spectrum under scotopic vision–must equal g(L)V(L) for some 100-CRI spectrum g(L), weighed by the photopic luminosity function V(L). For this reason, the transformed spectrum
F(L) = f(L)S(L)/V(L)
represents the spectrum which, under daytime/photopic vision, appears identical to the spectrum f(L) under scotopic vision. Thus, to calculate perceived CRI of a spectrum f(L), it suffices to calculate the regular CRI of the transformed spectrum F(L).
I think it could be interesting to add a toggle button that alternates between photopic and scotopic vision. If the scotopic vision button is toggled, then the tool multiplies S(L)/V(L) to the recovered spectrum to obtain a transformed spectrum, and performs colorimetry for this transformed spectrum.
I believe it’s monochromatic - rods don’t have types unlike cones.
Thanks, that really simplifies the project!
I guess the nontrivial question would be what happens in the mesopic “middle” regime, where colors are still distinct but noticeably distorted compared to daytime vision. This article models the mesopic luminosity function as a weighted average of the photopic and scotopic versions–perhaps the weight parameter can be user-adjusted.
the first time i can understand what this guy talks about lmao
I’ll take this as a sign that my writing/communication skills have improved!
i wouldnt doubt that, but i think its more jsut something i can understand lmao. like when you and enderman talk on those recoil builds i cant follow
I see, sometimes the discussion can get very specialized and depart from the scope of general interest. I’m really glad that we have BLF as a safe-space for these types of discussions, because reddit ain’t it 
Thank you very much for your deep interest in this subject and for your professional help in developing and testing the tool. To my surprise, this project has opened up an entirely new direction for further development that I hadn’t even considered before.
This new information is very interesting and has inspired me to add a new metric, Circadian Metrics, to the LED spectrum simulator. This is an actively developing area of research.
As for filter calculations, I think this is an interesting idea, but it deserves a separate tool with a user-friendly interface. At a minimum, it should have two panels: one for uploading the light source spectrum and another for uploading the filter’s spectral transmission curve. The user would then be able to obtain the resulting spectrum along with a comprehensive set of metrics.
I also need some time to learn more about the Purkinje effect, as I hadn’t come across it before. If there is genuine interest in this topic, we could develop a tool based on the three existing tools. Based on my initial research, this should be relatively straightforward.
I’m currently preparing the first release of the spectrum simulation tool.
Thank you very much for starting this project and building the tool! It’s been my dream for a while to have access to a program that helps me understand the correspondence between spectral features and colorimetric readings, without messing with giant spreadsheets. Your project made this reality.
This sounds interesting. I’m not at all well-versed in the biological effects of light, so I’m curious to learn what you come up with.
I think that’s a sensible idea, to avoid cluttering up the existing tool too much–it is perfect as-is.
You might not have heard the name Purkinje, but I bet you’ve noticed this effect already. The ~6000K of noon daylight looks perfectly fine during the day, but blue-grey and unpleasant at night in the form of an LED bulb. A ~4000K flashlight looks yellow during the day, but the same 4000K temperature looks cold and harsh at night in the form of moonlight.
I agree that implementation should be straightforward–one just needs to obtain a numerical version of the scotopic luminosity function, and perform the spectrum modification described in an earlier post.
Thank you! By the way, I couldn’t get your comment about the graph needing a 2:1 aspect ratio out of my head, so I added a button that dynamically resizes it to that format. It really is much more convenient.
I also wanted to ask: has anyone actually tried the Windows 95 theme on the website? I originally added it just for fun, and sometimes I think it looks really cool. But that’s just my personal opinion.