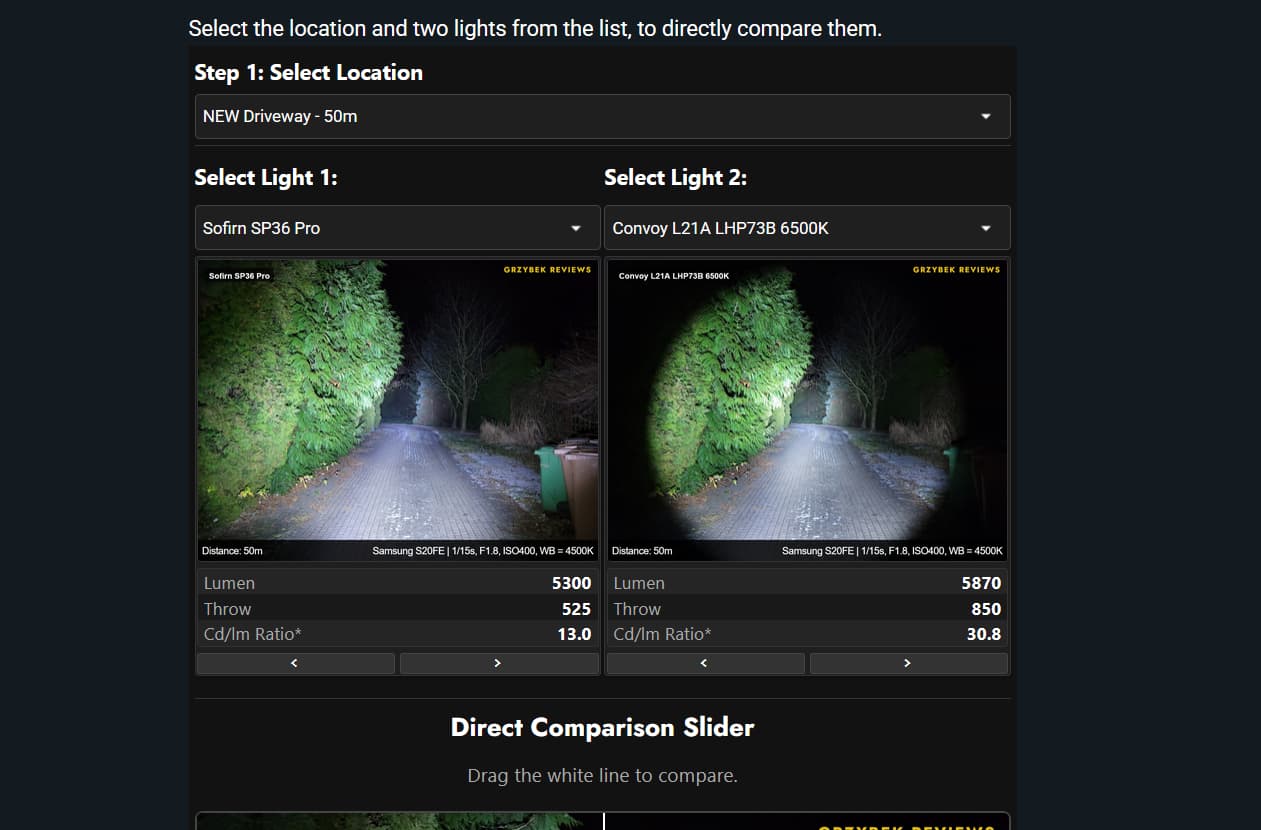
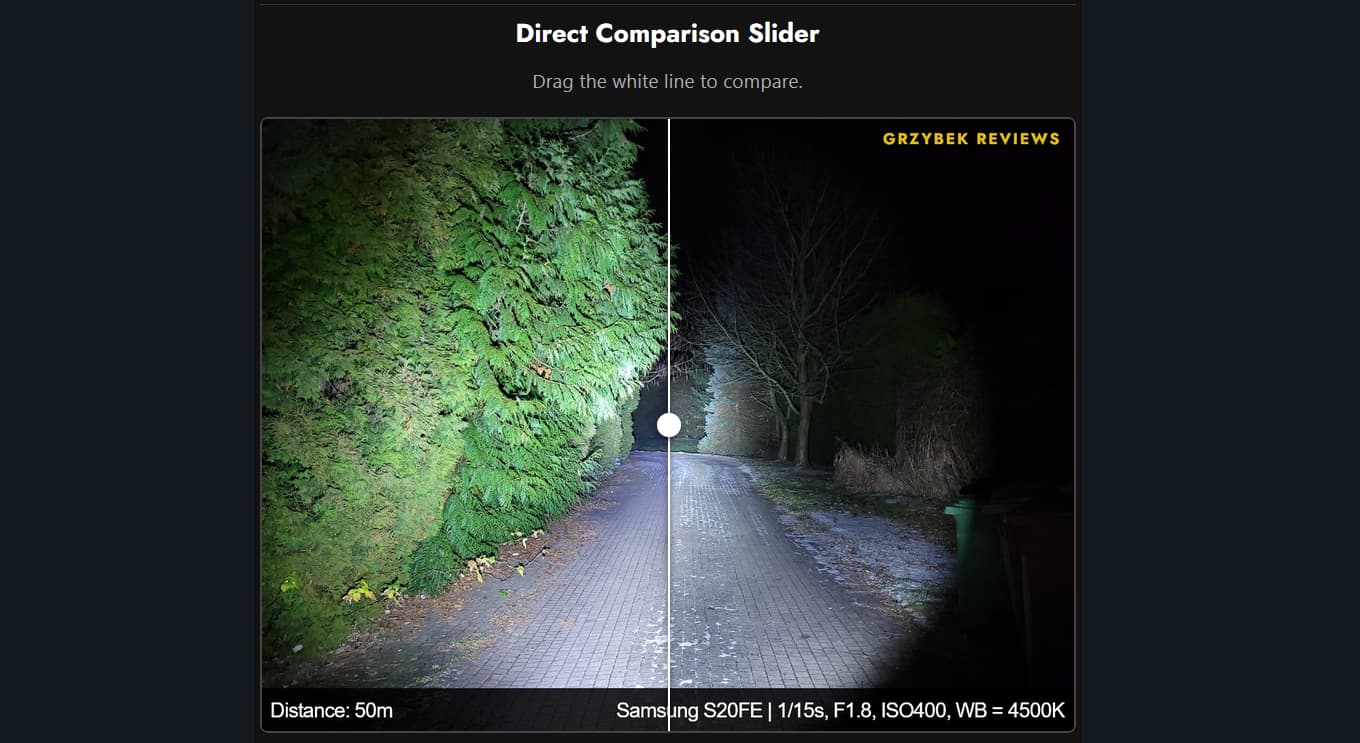
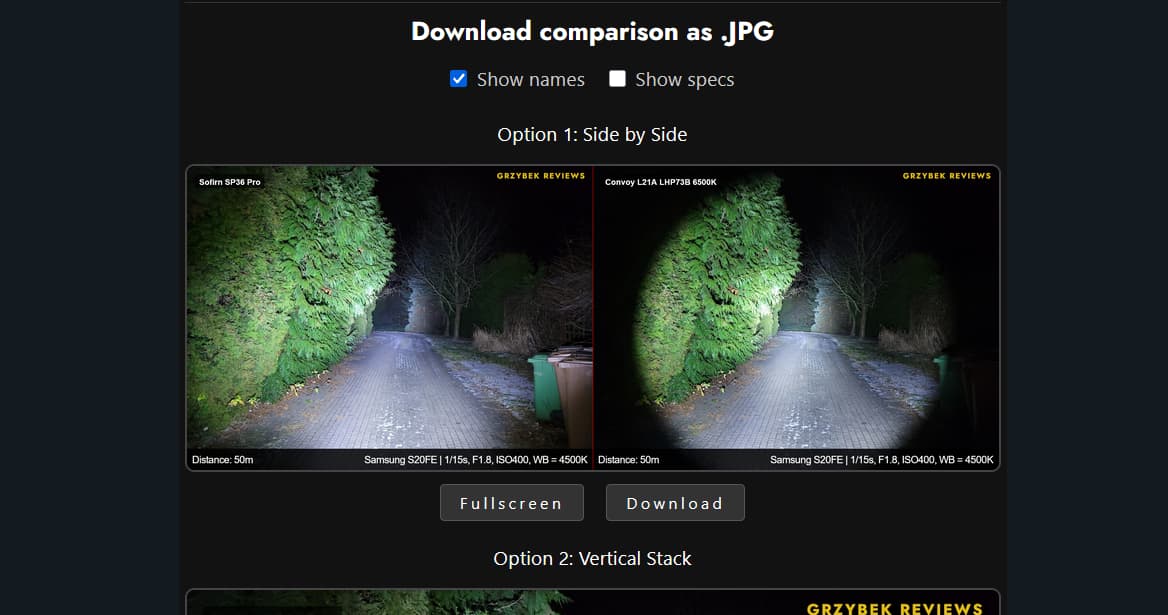
Inspired by Wikilight.de, the Beamshot Comparator is a tool made to compare the large amounts of beamshots that I have taken over the years. I decided to try and make such a tool, seeing as Wikilight hasn’t been updated with new lights for the past couple of years.
I coded the comparator with the help of Gemini Pro. The entire comparator itself fits inside a “Custom HTML” block in this WordPress post, while the beamshots are uploaded to the website and added to the comparator code as image links.
To help with adding large amount of beamshots to the comparator (with all the specifications), I use a script that helps semi-automate this process.
I’m releasing the code on Github, free for anyone to use. You can find it in the link below:
I’d love to see others create similar tools with their own beamshots.
I also added a compressed comparator, which could be used in reviews or comparisons. It doesn’t have the comparison downloadable section, only includes beamshots for 1 location and is easier to upload beamshots to.
Added 13 new flashlights (in 3 beamshot locations):
Convoy:
L21A - SFT90
L21B - SFT25R, SFT42R
M21B - SFT42R, SFT90
M21E - LHP73B, SFT25R, SFT70
M21H - LHP73B
M21K - LHP73B, SFT90
Wurkkos:
TD01C
TS28
All flashlights have been measured for lumen and throw.
Added a distinction between “0s” and “30s” lumen measurements.
For the new Convoy 20A driver flashlights (e.g. M21K, M21E LHP73B) I also included a “high” beamshot, as the turbo is only momentary.
I think this thread (and the online app behind it) has been vastly underappreciated - just try it to see how much easier it is to make purchase decisions when you can easily figure out what to expect.
This, and maybe + the Map to see how close the lights you know are to the lights you want… :-)
On the subject of beam profiles, some users may find this helpful:
Given basic LED/reflector measurements, it generates an exact prediction for the hotspot/spill/corona angles, and visualizes it as a slice of the beam through the axis. Here’s a slightly more elaborate introduction/post about it on the subreddit.
Additionally, entering 2 more inputs (OTF lumens and emitting area) gives a prediction of maximum intensity/throw.
Created scripts that allow to quickly go through a large amount of CSV runtime measurements, clean them up, convert lux to lumen and upload everything to the comparator.
Added the ability to set a default location and beamshot, for when you first open the website.
Feel free to compare them. I will be uploading my own comparisons created using the tool soon (e.g. L21A vs L21B with the same emitters, SFT60 comparison against SFT90 & SFT42R etc…)
Update 06.08.2026 (DD.MM.YYYY)
Added throw measurements at turn-on (0s) to about 40 flashlights. Rather than being actual measurements, I calculated these values based on the turn-on (0s) lumens, 30s lumens and 30s throw value using this formula:
sqrt(0s lumen/30s lumen)*30s throw = 0s throw
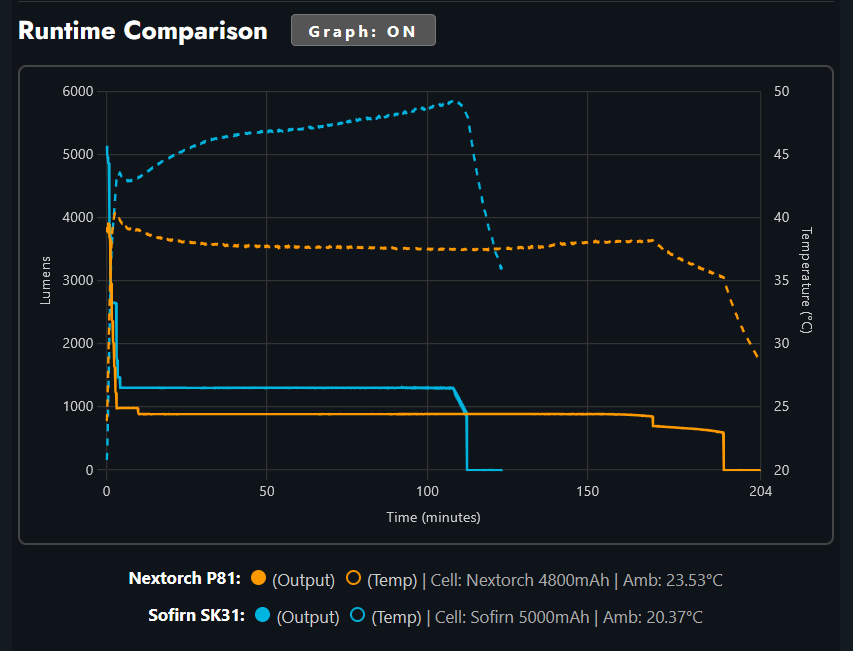
Added the ability to turn the graph off, as I noticed that having it redraw itself every time you changed the flashlight was quite taxing on lower-end devices and caused a lot of lag. (On by default, though)
Added a small watermark to the beamshots and to the generated graph (only when the graph is downloaded). The watermark can be turned off, but I’d politely ask for you to not do so. I’d want to spread the word of the tool I created to more people.
When “downloading” images on chromium-based browsers by simply dragging the images to e.g. your desktop, they will now be given a proper name instead of “Untitled.jpg”. Doesn’t seem to work on Firefox though, sadly.
Updated/redid runtime graphs and measurements of certain flashlights
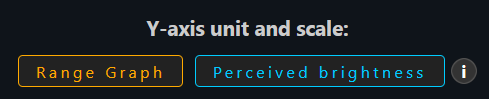
Range Graph Mode: Added a toggle to view the graph in beam distance (meters) instead of lumens, with options to scale the range to 1x (ANSI FL1) or to 0.5x & 0.33x for a more realistic range.
Graphing & Export Improvements
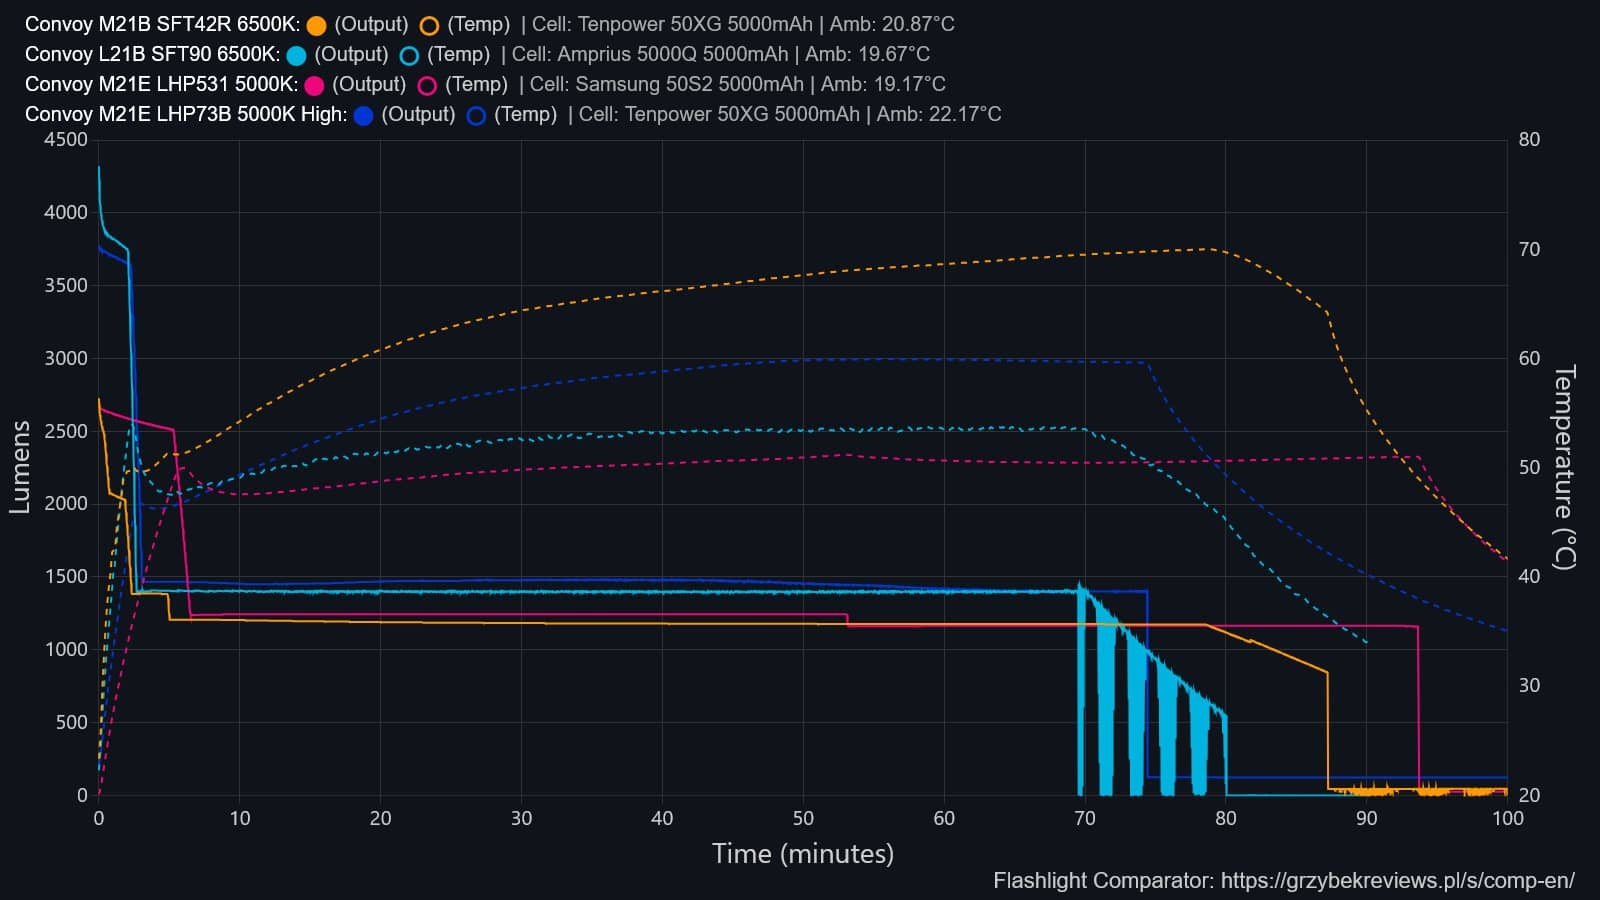
New Chart Legend Formatting: The legend now displays the specific battery/cell used for the test and the ambient room temperature.
Graph Axis Controls: Added manual input fields to lock the Max Y limit and Temperature Min/Max bounds, alongside smarter “Auto” and “Full” time axis scaling.
I find this especially helpful as I use this tool to generate runtime graphs for all my tests/reviews.
Temperature Data: Fixed temperature line visual style by applying a smoothing function to the data.
I honestly dislike that location. It changes too much during the year (foliage, ground reflectability) and doesn’t have a proper target at the end to judge the throw. Finding a better location will prove difficult, though. We’ll see.
While that is true, I wouldn’t worry too much about it because camera photos are already notoriously unreliable for estimating throw and spill, even with well-controlled conditions. You already publish detailed measurements on intensity, output, and runtime, which is more than enough information for anyone to get a good sense of both absolute and comparative performance.
IMO the purpose of beamshots is to give the viewer a rough idea of beam profile; this is unaffected by minor variability in viewing conditions.
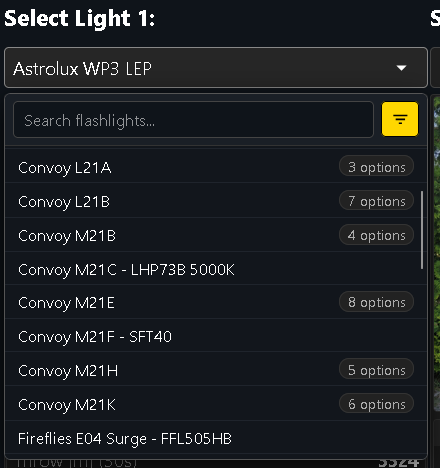
Model Grouping: Flashlights from the same series (e.g., Convoy L21B) are now grouped into a single entry, which you can click to expand and select the specific emitter/variant.
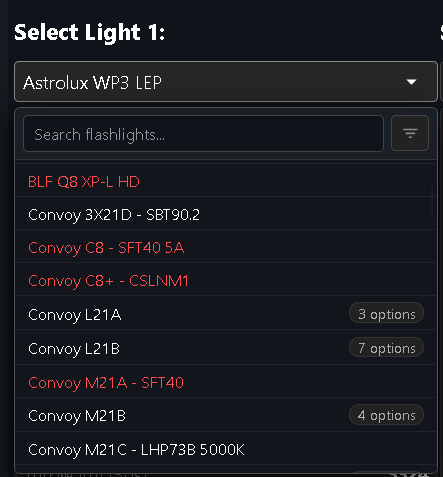
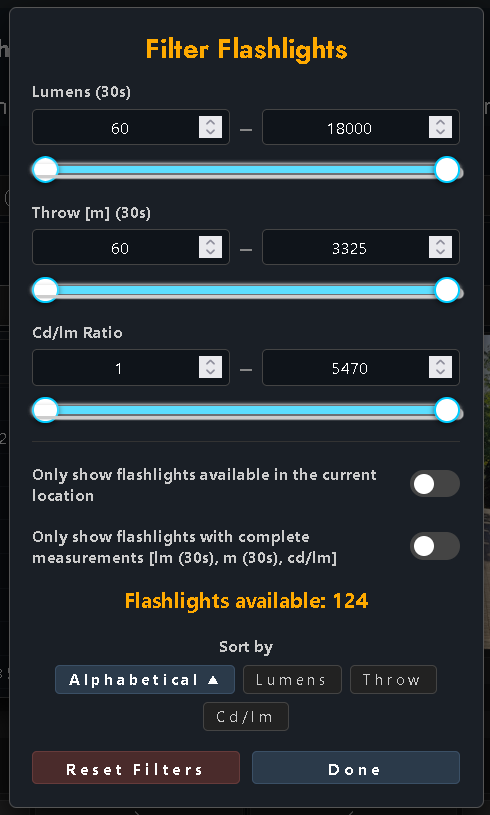
Filtering: You can now filter through the available lights, as well as show all flashlights available in the database (which is the case by default). Flashlights inavailable in a certain location will just appear with red text.
Sorting: You can now sort the database based on my measurements (e.g. sort by cd/lm and scroll through the beamshots and see the beams get more and more focused.