Please, if possible, find spme correlation between the surface area of the reflector and the intensity per surface area of the projection…
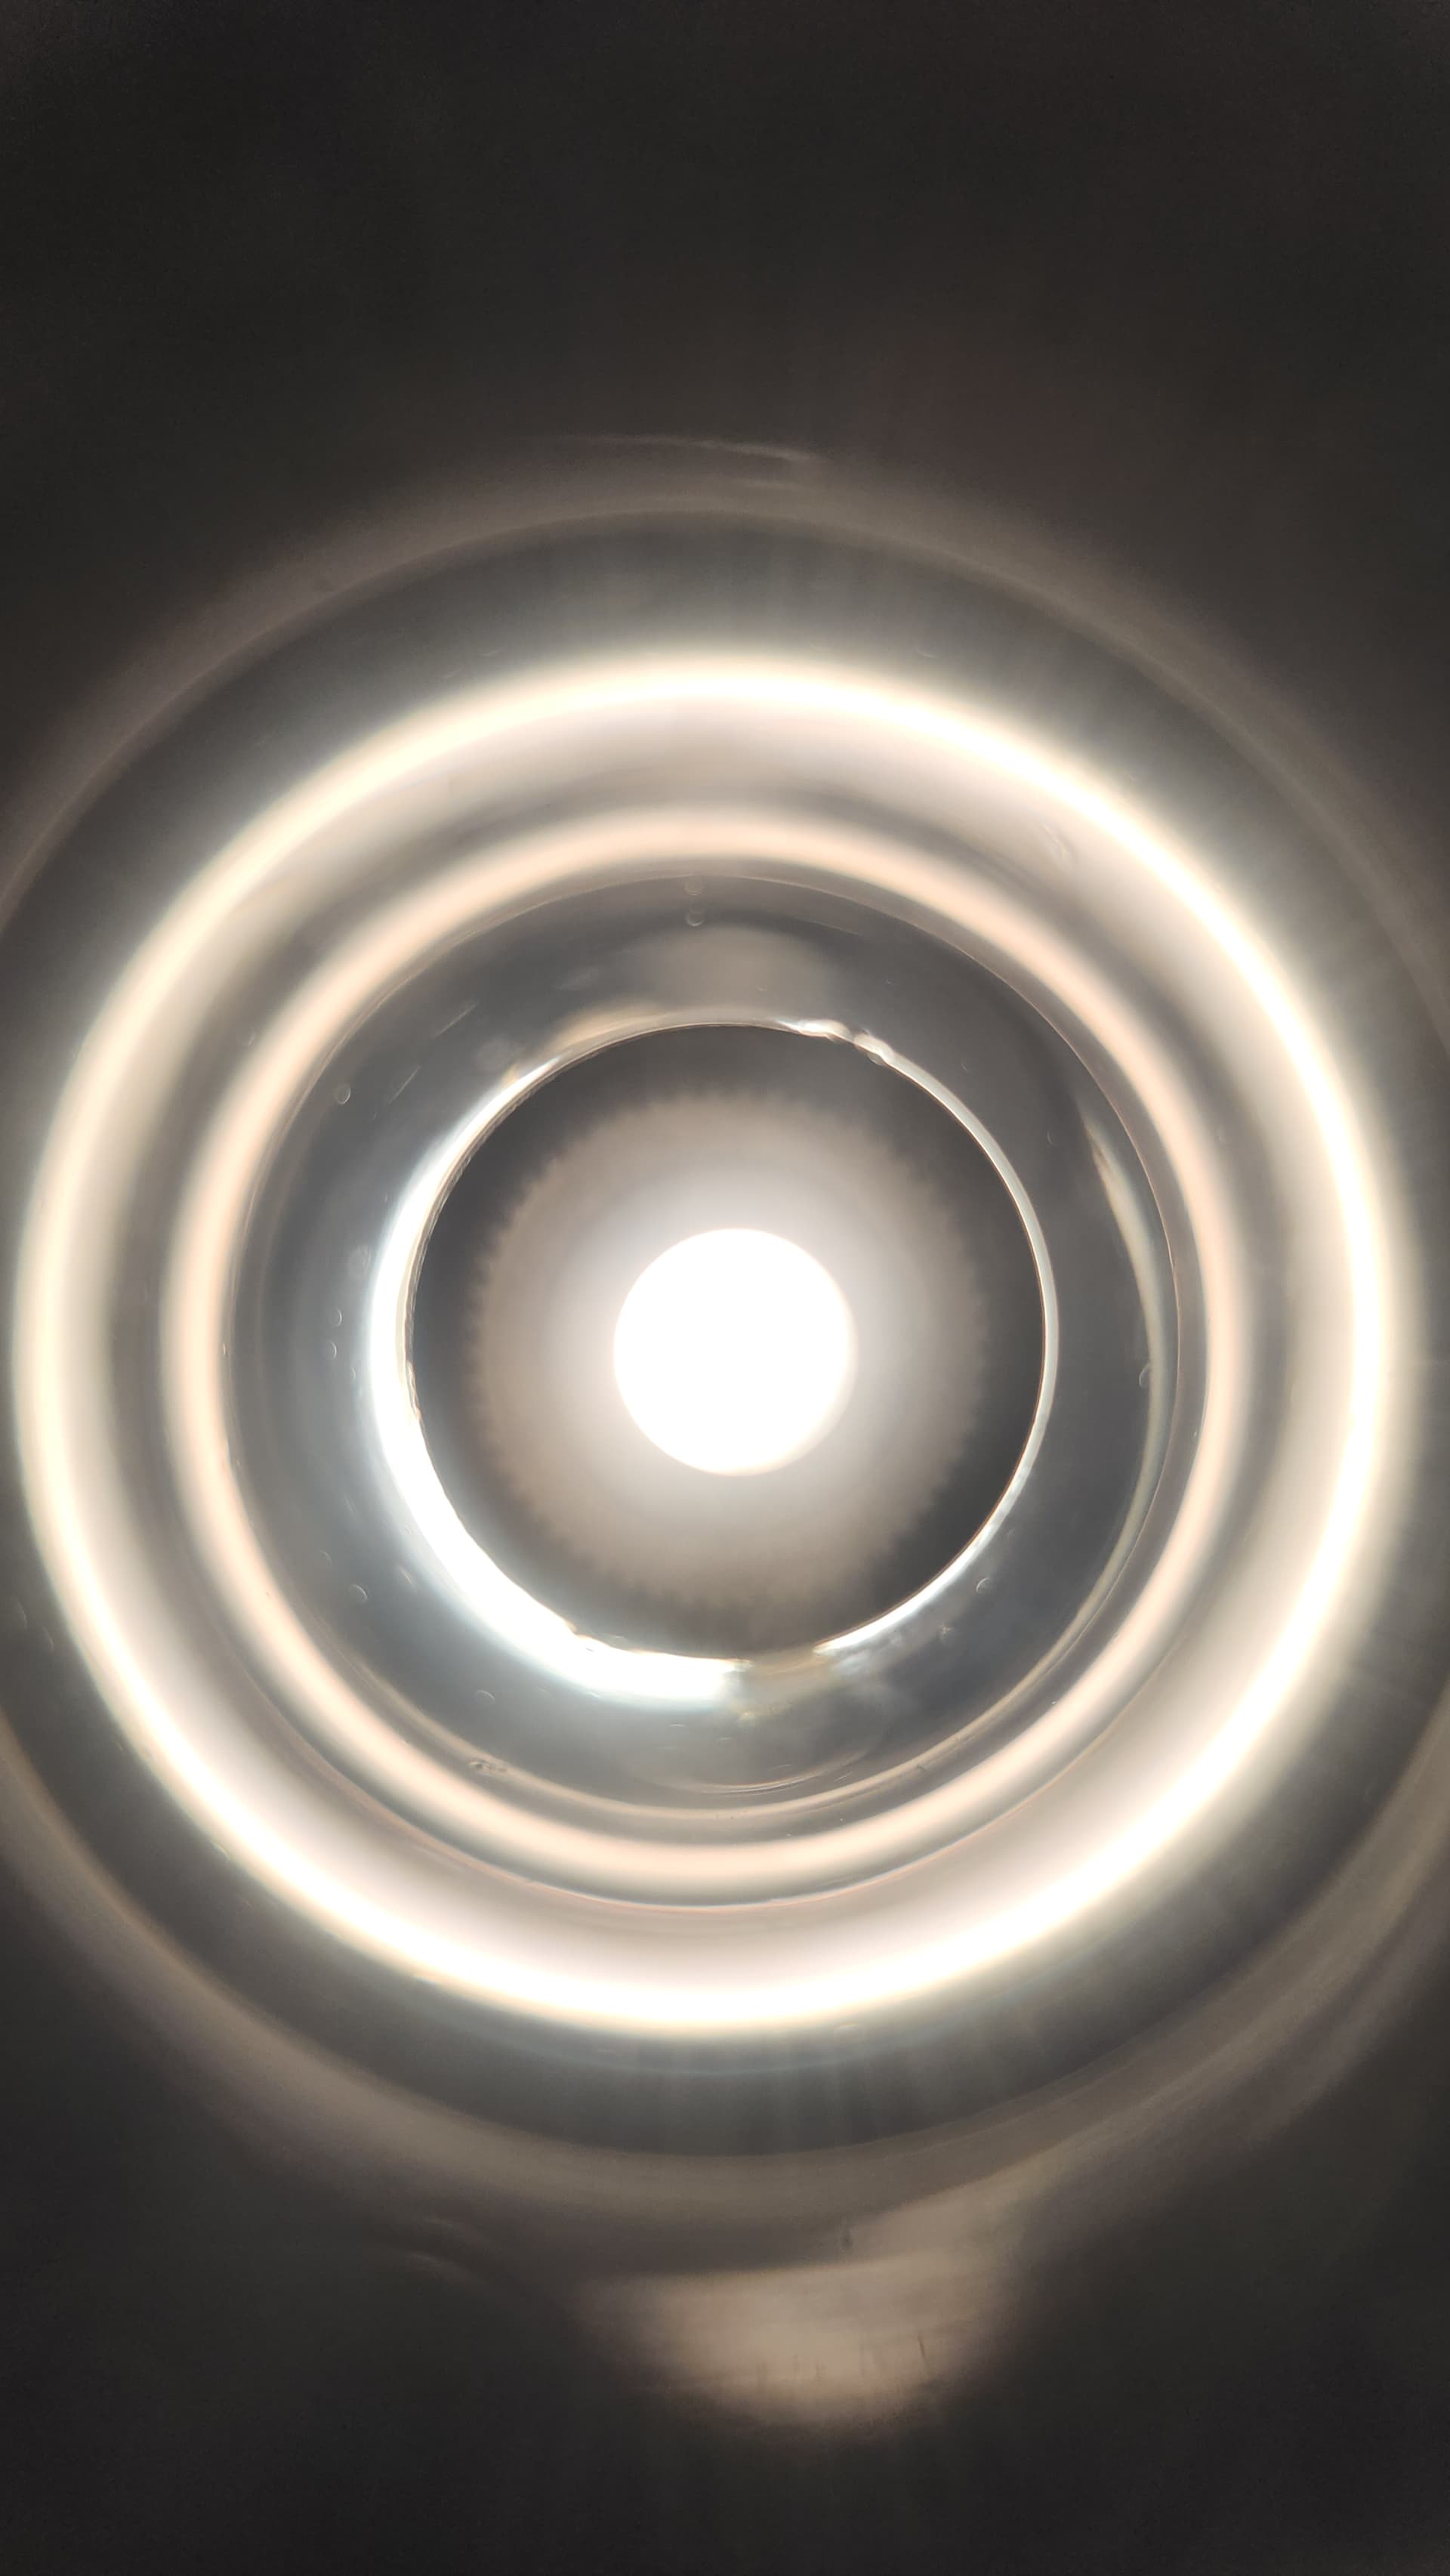
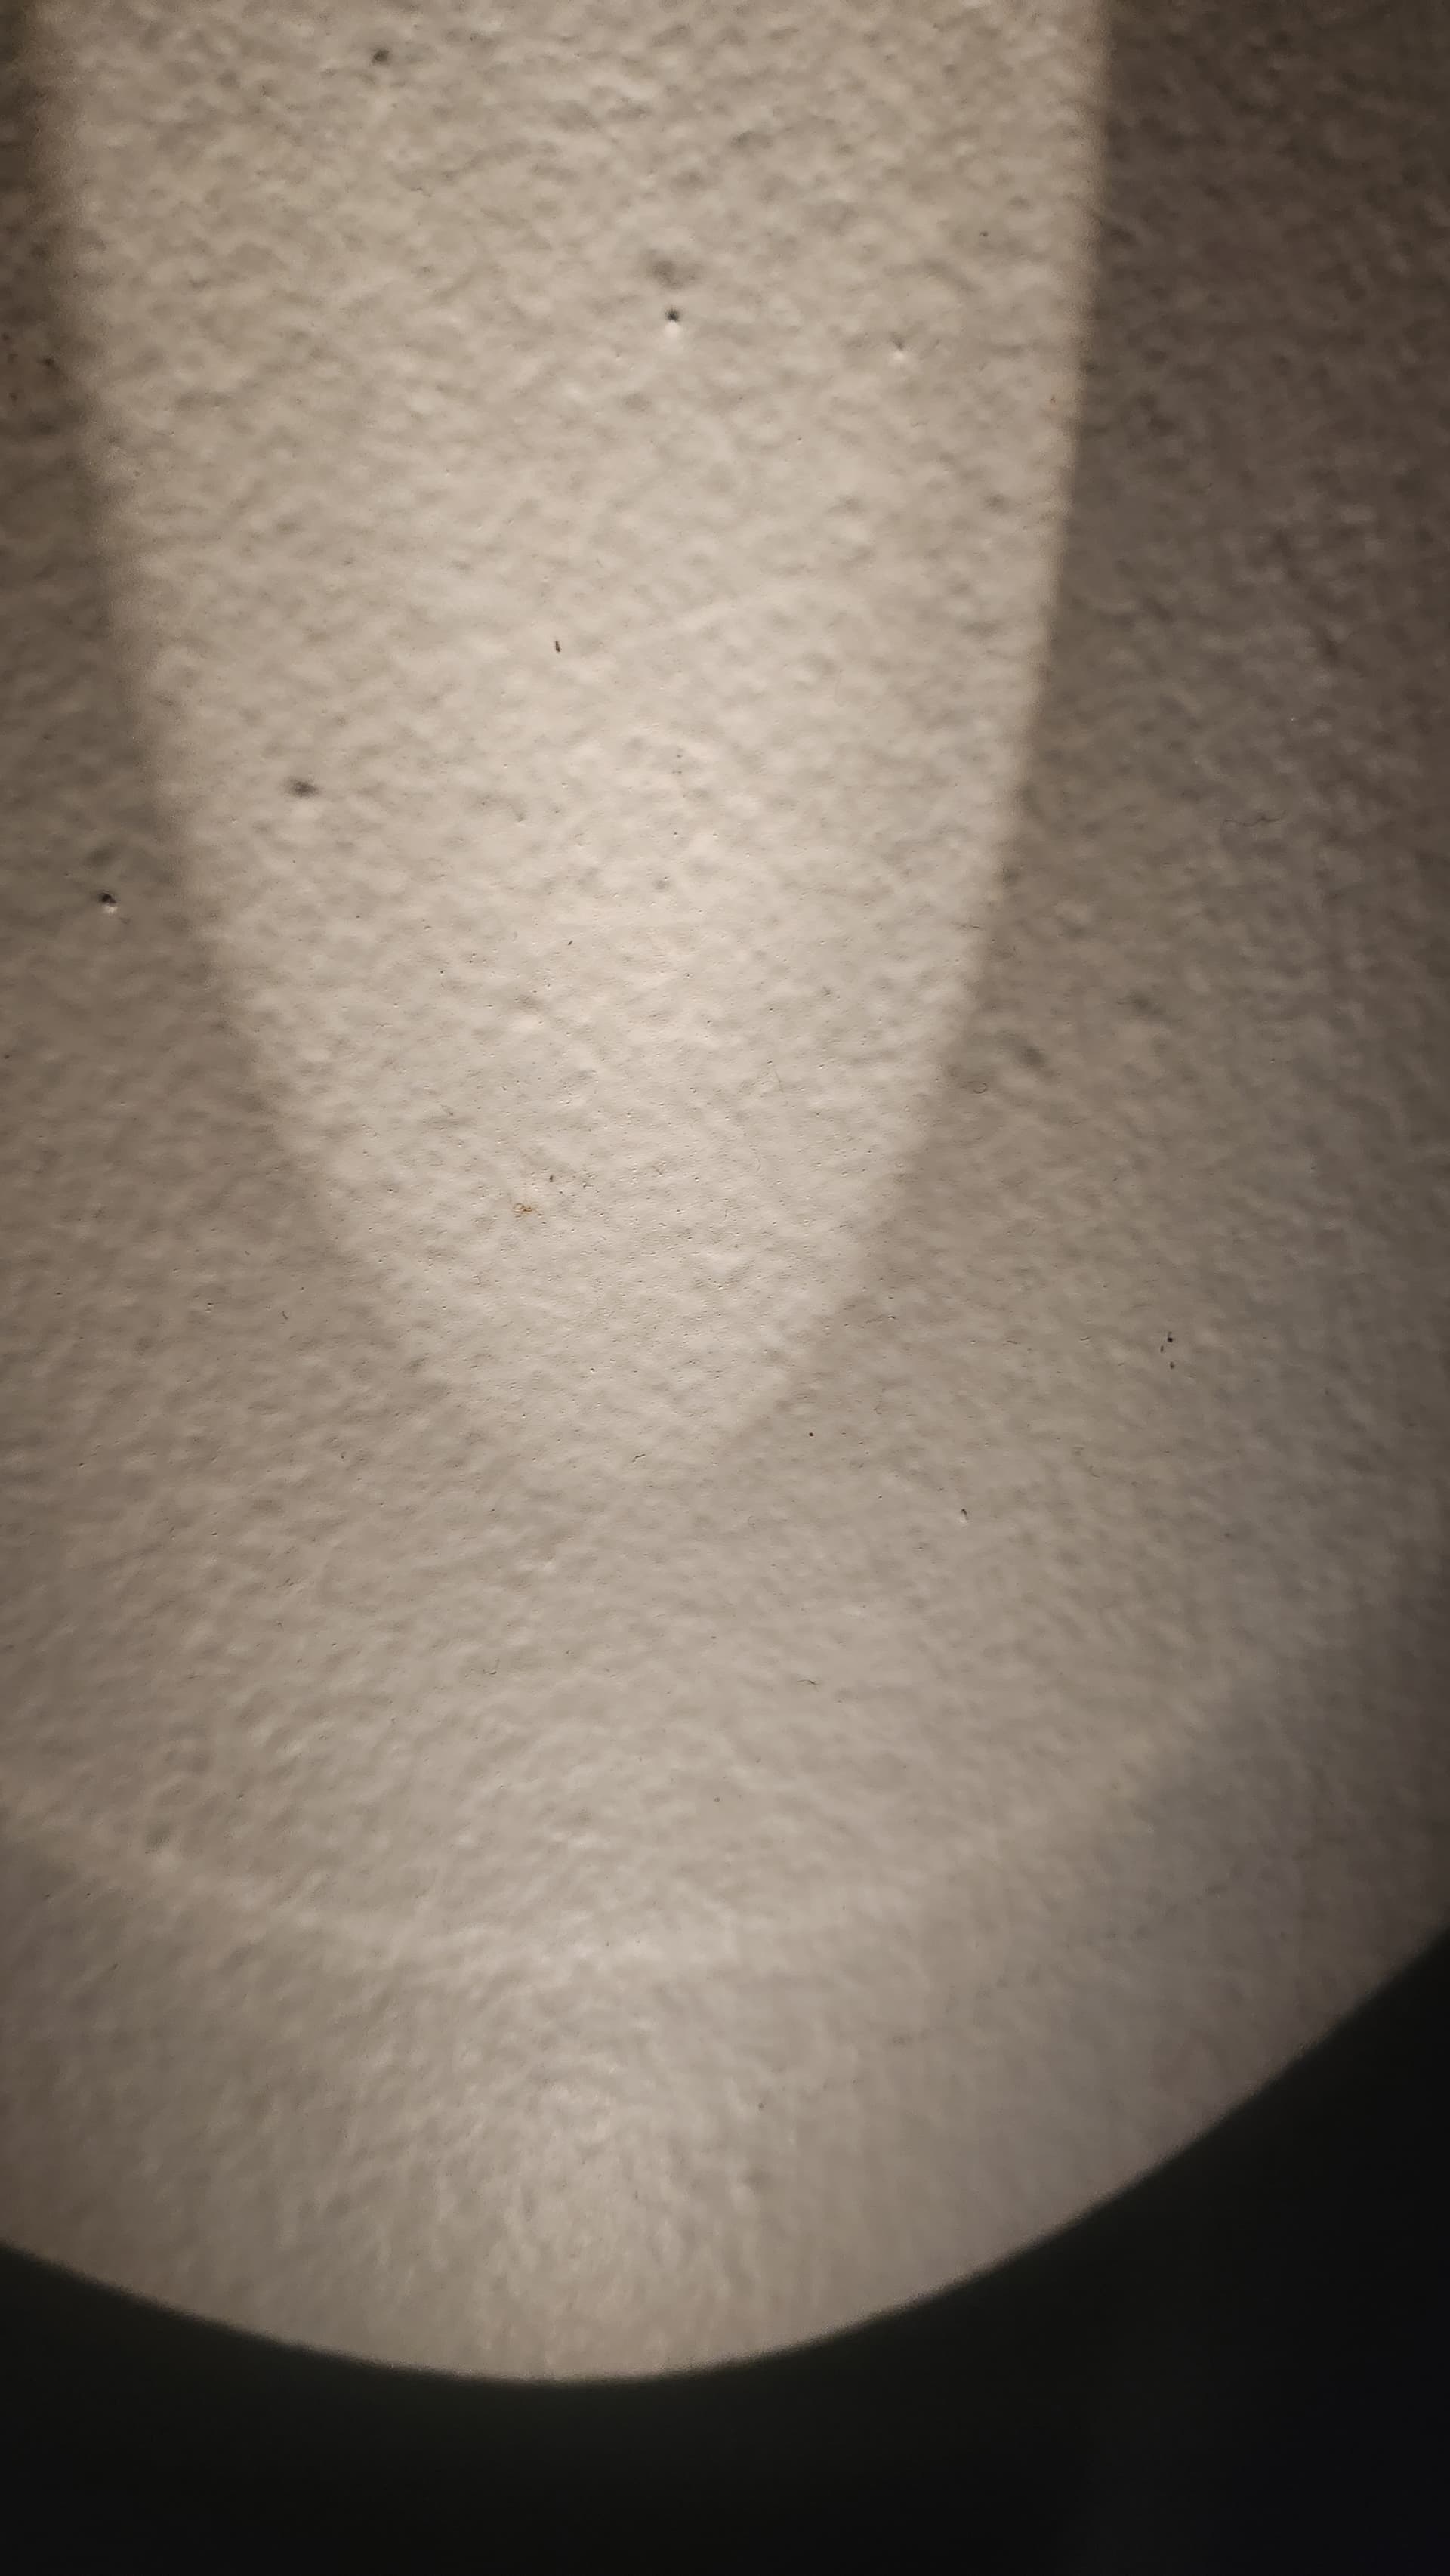
Photos attatched for examples of an optimally focused yuji in a 2d mag:
You might be able to see that there is a distinct partition within the hot spot, as well as a ring that splits the spill, where the ring is almost as intense as the corona.
Yuji in a 2d mag (originally LED or incan?) is an interesting situation. The Yuji is not a Lambertian emitter and will mess with relative intensities, but the division into hotspot/corona/spill should be largely unchanged. Also curious where the ring in the spill is from…
Hole size at bottom of reflector.
Exact interface of LED and the bottom of the reflector.
Dome versus no dome.
With some reflector sizes a larger hole means a much larger hotspot and less throw. The reflector on the GT mini has a fairly wide barely beveled polished area around the LED.
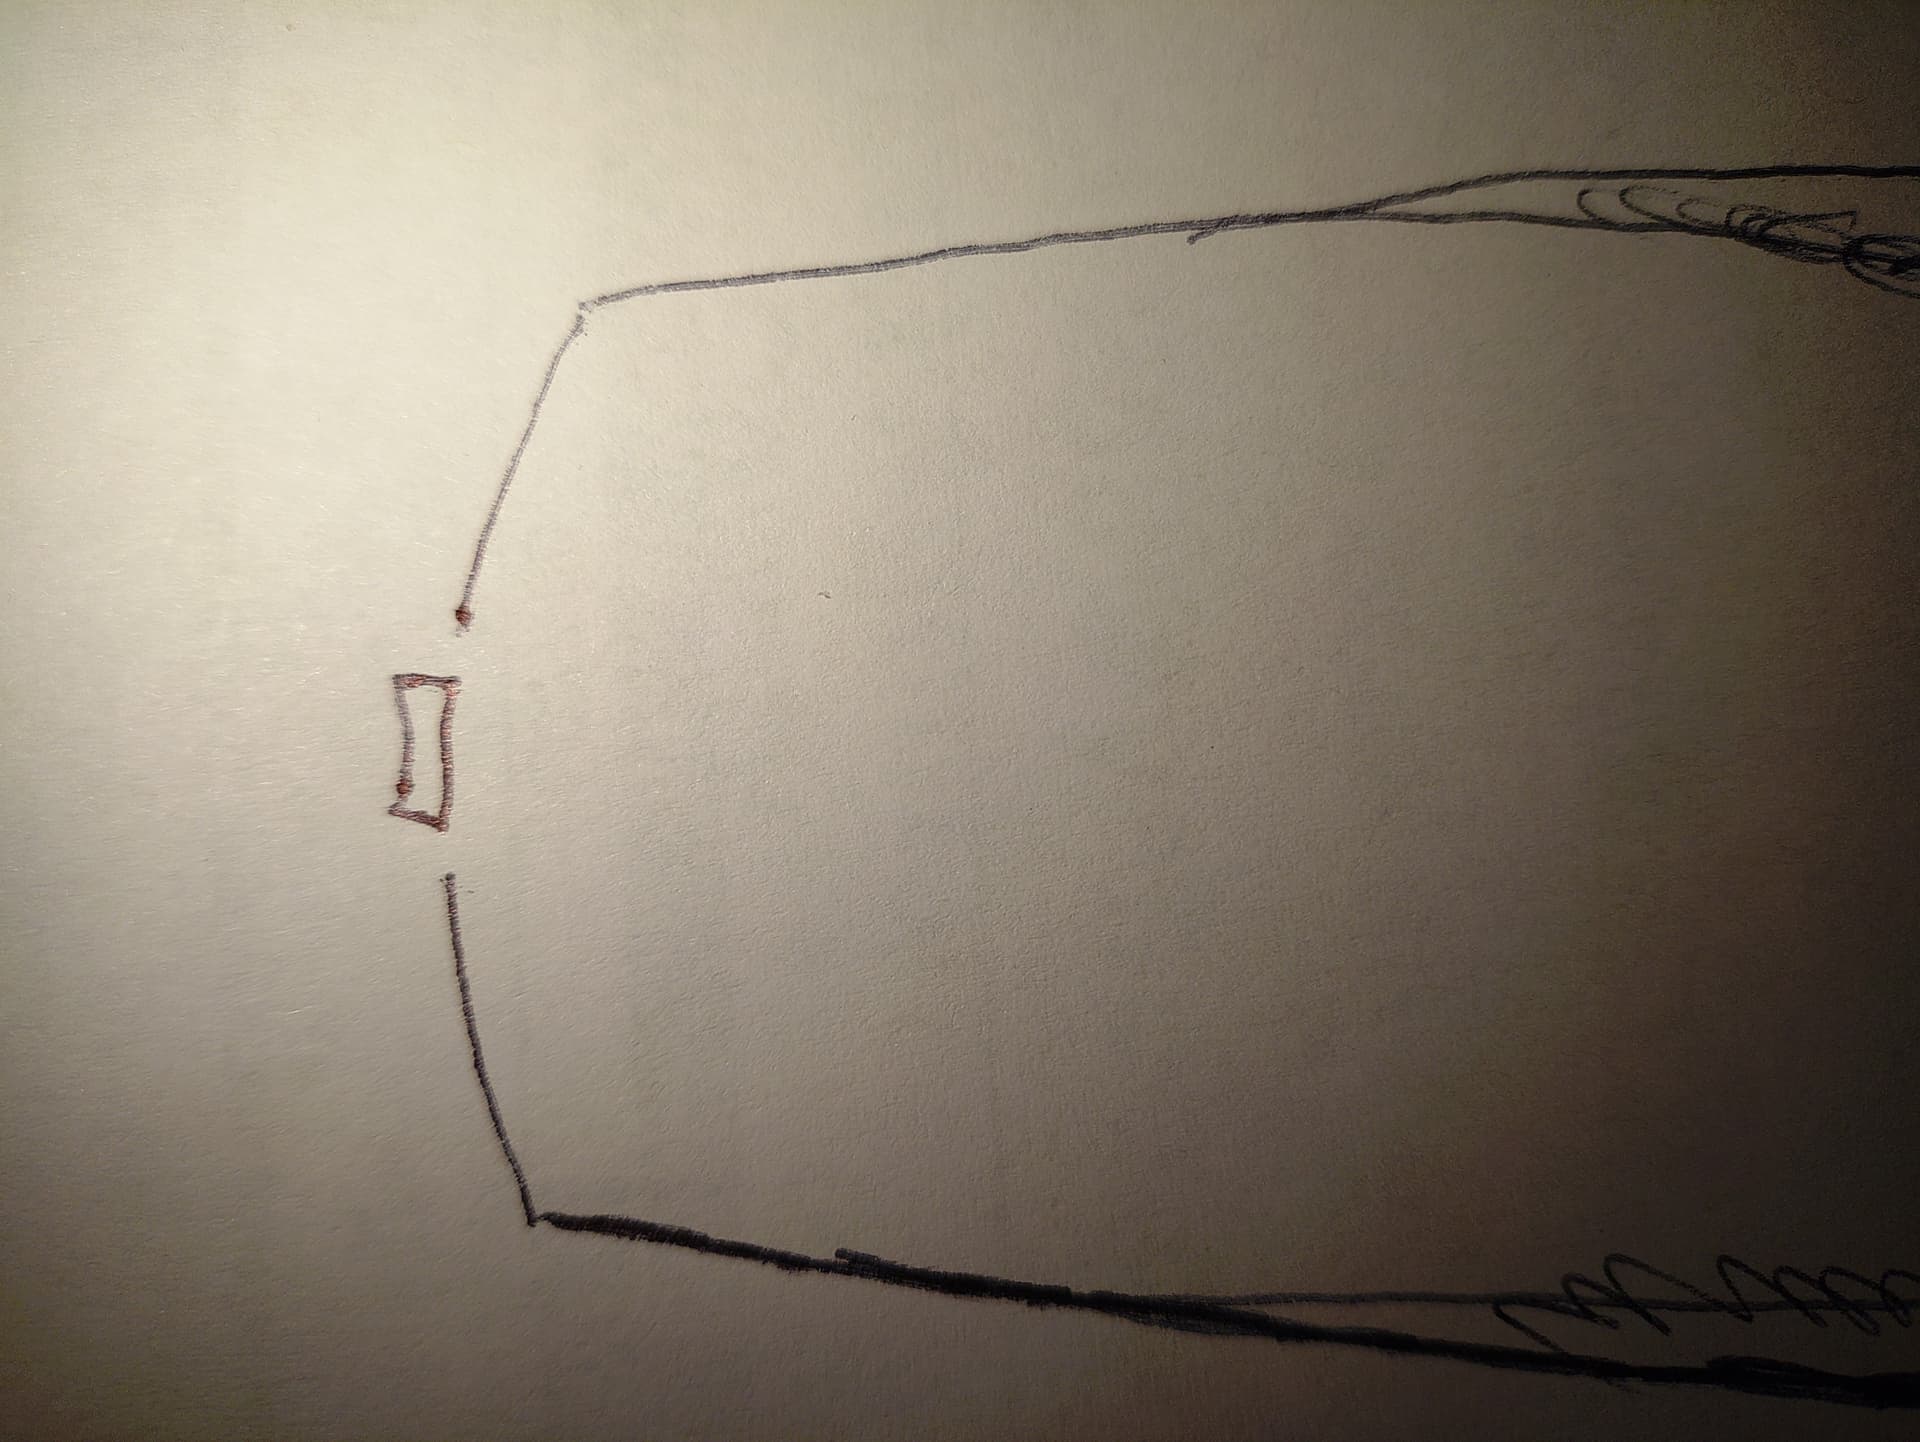
And it’s one of the tightest hot spots that I have. This is a slightly exaggerated drawing.
The camera shows it forming because of the rim/lens reflection. Pic incoming in a minute…it’s too blown out, I can’t get a good pic even after reducing the exposure…
But basically, it seems to start at the bottom edge of the reflector closest to the led, then seems to refocus or amplify right at the edge where the reflector meets the lens, almost as if some extra refraction/lensing is going on. Looks very similar to the sun peeking around the earth.
There have been new developments at the Map of Flashlights as to hotspot angles, including the near-final model description.
This is good news for the ray-tracing model.
For the special case of single smooth reflectors - if you know their specific h, D, and d values - a hotspot boundary derived from the ray-tracing model must coincide with some value of the max intensity fraction that I use to define where the hotspot ends, and thus potentially improve predictions for individual lights in this subset (as long as it complies with the etendue conservation).
Thank you very much for the update! I’m sorry that I was away for a while, mostly traveling and grading exams. Looks like I’ve missed many exciting updates!
(1) For the Map: do you have an explanation somewhere of how the hotspot size values are obtained? If so, I may have missed it. I would be very interested in comparing it with my ray-tracing model.
(2) I built an exact simulation of a parabolic reflector in 2D, from which you can get what the simulated beam looks like and some critical measurements like hotspot/corona/spill angles. I will post it in a separate thread and edit this comment to include the link. Play around with it and let me know what you think!
Hey thanks for sending this! A couple items I’d like to ask more about:
(1) How do you justify the assumption of Gaussian beam profile? Almost every beam profile (esp. mules and aspherics) is well-known to be non-Gaussian, though I suppose that Gaussian is a reasonable distribution for modeling any distribution that is unimodal and symmetric, which describes most beams. I suppose I could use my exact simulation to determine the accuracy of the Gaussian approximation.
(2) The 50%-of-total-output threshold is a sensible definition of hotspot, and will be very close to my purely geometric definition for most lights. However, assuming Gaussian beam profile, the right FWHM angle is not 2.35 times the standard deviation, but possibly around 1.1774 times the standard deviation. The 2.35 comes from a one-dimensional Gaussian distribution, but beams in 3D space are approximated by a 2-dimensional Gaussian, which is slightly more radially concentrated. I would suggest going through all of the calculations (e.g., etendue) and checking for dimensional inconsistencies like this.
BTW, here’s a new version dedicated to computing hotspot/corona/spill angles. I like geometric approaches because they are essentially dimension-independent.