How to make runtime graphs or automate measurements?

Hi! I’m new to this flashlight hobby. Until recently I thought flashlights just had to be a bit crap and…cold hehe. Now I can’t stand all the flashlights, headlamps, bike lights I have. Square, weird beams, ugly hotspots, colorless blue grey everything.

I wonder how people make all those informative runtime graphs, or automate this or that. I find doing much simpler measurements manually headache-inducing…and blinding. I’ve just been staring at the wall using a timer trying to figure out when a flashlight steps down and how ambient temperature affects it for example.

As a photographer and printer I happen to already own a

  • Gretagmacbeth EyeOne Pro spectrophotometer, later rebranded X-Rite i1Pro. (Though it is 15 years old and never serviced or recalibrated)
  • Sekonic L-358 light meter
  • A bunch of Gretagmacbeth/X-Rite and Babelcolor software (good for temperature,CRI,R9++ measurements)
  • At work I also have access to a more recent X-Rite i1Pro 2 spectrophotometer and one of the high end Sekonic light meters that I can’t remember what is called. Sekonic L-858D I think.

Can any of this be used in combination with some software to get some runtime graphs or other interesting nerdy stuff? I also have an android phone and some Canon and Fuji cameras if that’s relevant. :slight_smile:

Welcome aboard!
There are various ways to go about this.
For Lumen measurements some type of home made Lumen – Tube – Box – Sphere.

Use a Lux meter to measure output, and a conversion formula – derived from making readings against a known light source.
Not sure if any of your light meters can act as a substitute. I used to use an incident meter and ceiling bounce to compare light outputs.

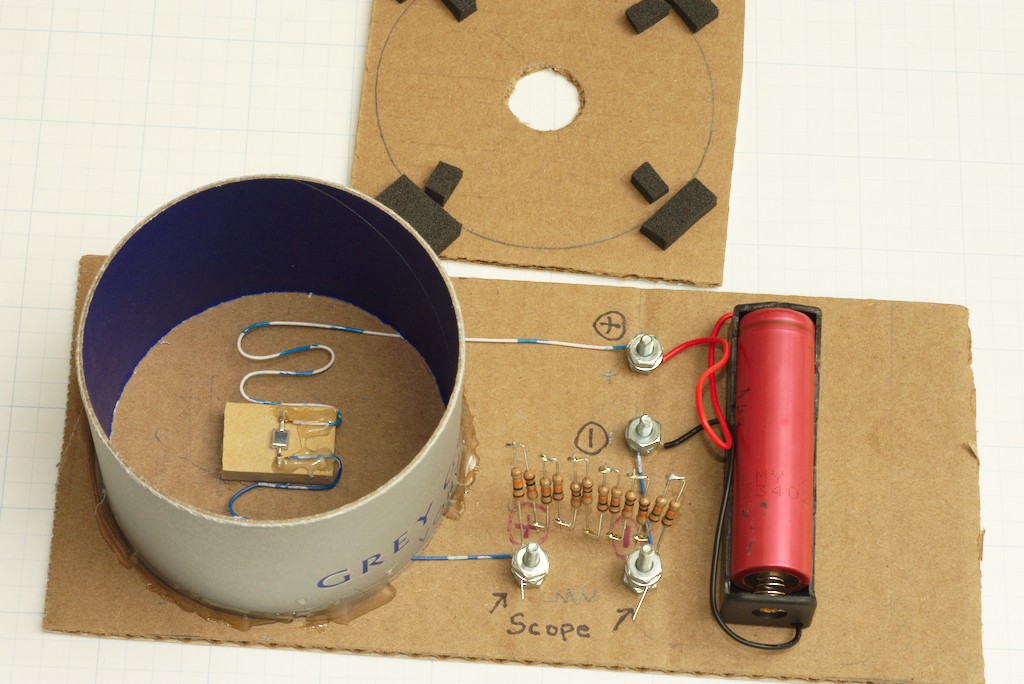
A device can be constructed to read out directly in Lumens. Not the easiest thing to do.
Here is how I did it.

Or Purchase one from Texas Ace if he still has parts to build another.

PWM and waveforms can be looked at using a computers sound card and some free software.
A simple and cheap Photo Diode circuit can be constructed to used to convert photons to volts.

At the top of the thread are links to other threads that talk about this.
Runtime graphs require some sort of logging software or device.

There are Lux meters with data logging capabilities.

and

Or the Photo Diode circuit can be connected to a logging device that can sample the voltage at specified time intervals. There are various devices that can do this.

Some have done this with a raspberry pie. I use PICO oscilloscope data logging for my PICO Scope. Then graph it in Excel or Libre Calc.

I did my first Runtime charts by using a lux meter, a timer, and video. I’d play back the video and graph the time and output. This got old in a real hurry.

Keep poking around and you will find various folks who do this. Terry Oregon, dozz, HKJ, and others.
Good luck falling down the measurement rabbit hole.
All the Best,
Jeff

Also your spectrophotometer goodies should be able to get you color temp readings if they can read from a light source as opposed to a print.

1 Thank

I built a lumen tube with three PVC M-F 90 degree connectors, a frosted glass circle to sit a flashlight on, an ND filter, Adafruit TSL2591 light sensor and a Raspberry Pi. Owen helped me with the design.

Calibration lights from maukka have been used to determine the correction factor to be able to convert from lux to lumens.

I’m using bmengineer’s Python script to record lux measurements over time. The data is saved to a CSV.

I then create a graph using a Python script.

I tried using a VEML7700 but the measurements were lower than expected when testing flooders.

A large 0.5m integrating sphere may be better than PVC tubes. I.e. Hollow polystyrene ball. Some party supply stores in Australia have small ones. You might have more luck in the US or Europe.

I usually start by testing the beam distance of lower modes so that the time to recharge batteries is reduced.

Check ANSI NEMA FL1. Measure the lux with a light meter at a distance of 1m, 10m or whatever you prefer. If it’s a thrower or LEP, consider 20m or 50m.

Flashlight mounted to a tripod.
UNI-T UT383BT mounted to a wall.
Measure the distance (e.g. laser meter).
Turn on flashlight and start a stopwatch.
Note down the lux after 30 seconds.
Power off and recharge.
Repeat for each mode.
Consider doing multiple measurements of the same modes and averaging. Move the beam slightly so that the hotspot hits the sensor etc.

This is one of the more manual testing procedures. Runtime testing is mostly automated.