Expanding on these posts:
Terry Oregons - Testing various sensors for changing Photons to Volts.
A must read for those interested in getting the best performance for waveform analysis.
My post about building a sensor from Terry’s design.
My post about using Audio software to measure PWM/
My post about trying O-Scope software to see PWM
All my previous testing was done using a 48KHz sound card.
In ToyKeepers post about seeing PWM in falling water or in a photo,
DavidEF mentioned that there are 192KHz sound cards available.
He also kindly sent me some LEDs to test as sensors as he did for Terry in the above post. My Thanks.
I commented on these higher sample rate cards in my previous testing using O-Scope software. I didn’t know if these would work with the software and what the results would be.
Well it kept bugging me so I just had to try one to see if it would work and what additional information might be seen.
Lights tested
My ever faithful Nitecore TUBE

A Pair of Rayovac Workforce

The New BLF SP36

Set the card to 192KHz

First I needed to set the sound card to 192000Hz in the Windows sound settings.
Next the same had to be done in the O-Scope software.
I used Visual Analyzer for these tests since it gives better screen shots. Find it here:
I did a series of captures using increasing sampling rates.
This illustrates the need for adequate sampling to show what’s going on in a waveform.
This is the Nitecore Tube in a higher ramp brightness with a PWM frequency of about 3050Hz (3.05KHz)
11KHz And again at 22KHz


At 22K Not much to see here, some sort of waveform.
AT 44K starting to resemble – something?
48KHz and again at 96K


48K the normal sound card sample rate. Starting to see a Square Wave.
And we see a duty cycle.
96KHz – Yep that’s a square wave all right
192KHz And my old BK CRT O-Scope.


Looking pretty good. And we see the duty cycle pretty darned well.
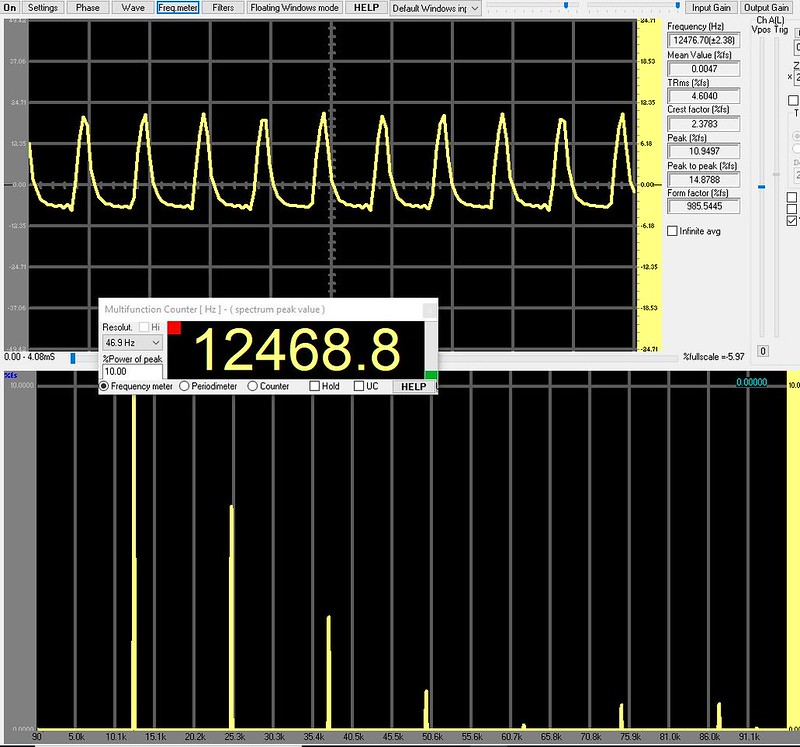
A cheap Rayovac 2 AA cell light. on Low

I measure about 12.5KHz PWM and the wave is sort of a triangle.
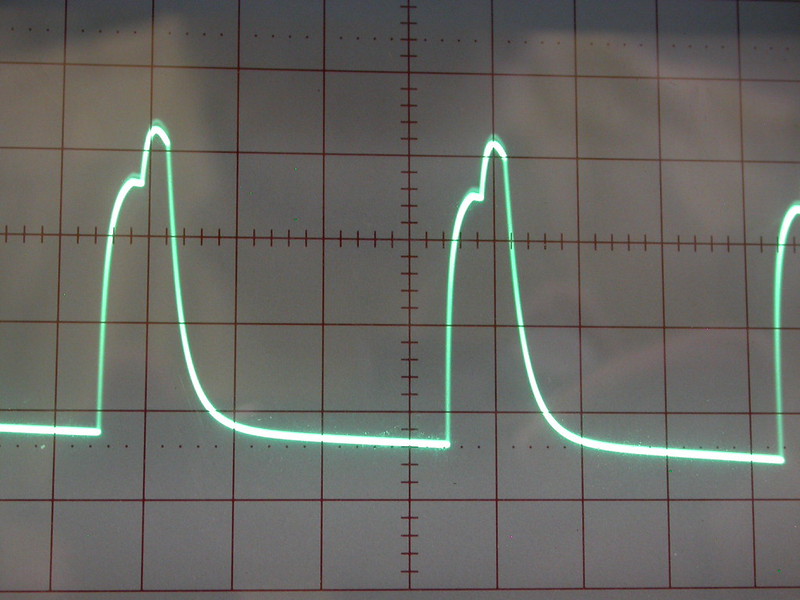
Here is that same light in the Real O-Scope.

Notice the top of the wave. That is masked in the software scope.
Rayovac AA on High

What’s this? A PWM of 62.4KHz?!
I thought the light was running full on until I pointed it at the sensor.
This would be missed by a 48K or even 96K sample rate on the Freq. Spectrum Analyzer - Or just appear to be noise in the O-Scope view.
Pretty formidable performance for a light that costs less than $15.
Makes me wonder what else might be out there that I just assumed was running all-ahead full.
Rayovac, 3 AAA headlamp. on High

It’s running 235Hz with the duty cycle running about 50%
I can just see the PWM but it’s not bothersome (well maybe a little).
Rayovac Headlamp on LOW

A whole new ballgame. You can’t even see the whole cycle using the same time frame.
The PWM drips to 188Hz.
Changing the time frame I see that it’s running about a 20% duty cycle.

The PWM is downright nasty to see.
Wonder why they could do such a good job with the AA light and yet this one is so awful. Does anyone ever look at these things before they are put into production?
The BLF SP36 with the Samsung LEDs.
(ToyKeeper – standing ovation for the UI – and the rest of the BLF team)
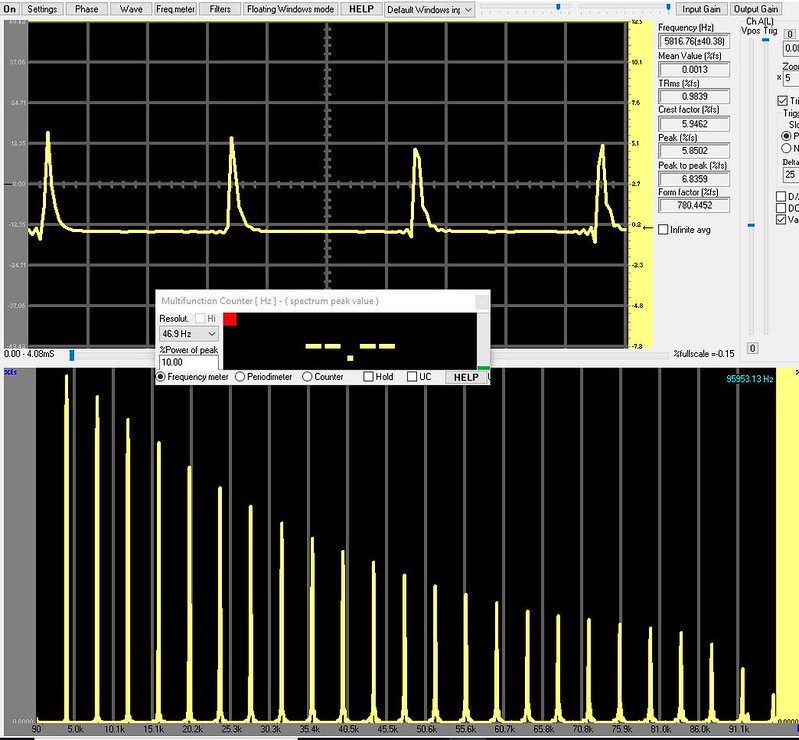
SP36 Moonlight. About 4.8KHz. Invisible to my eyes.

The frequency counter could not pick it up.
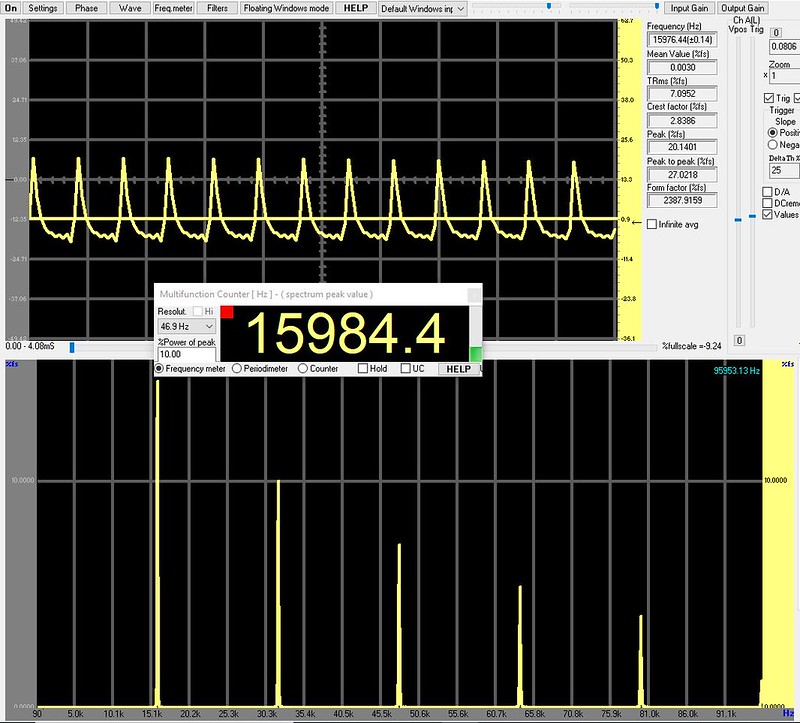
SP36 Ramping. 16KHz. Nobody is going to see this.

SP36 High Turbo. Move along, nothing to see here.

No PWM seen at this sample rate.
Conclusion?
I thought most PWM was limited to the audio spectrum. Using the 192K sound card show’s this not to be the case – at least in a limited number of lights.
A sound card with a 192KHz sample can show results that are invisible with a slower sample rate.
Taking a look at these lights, especially the ones with a crappy PWM, perhaps some minimum standards could be established to keep the blinkies at bay.
More light test to follow.


