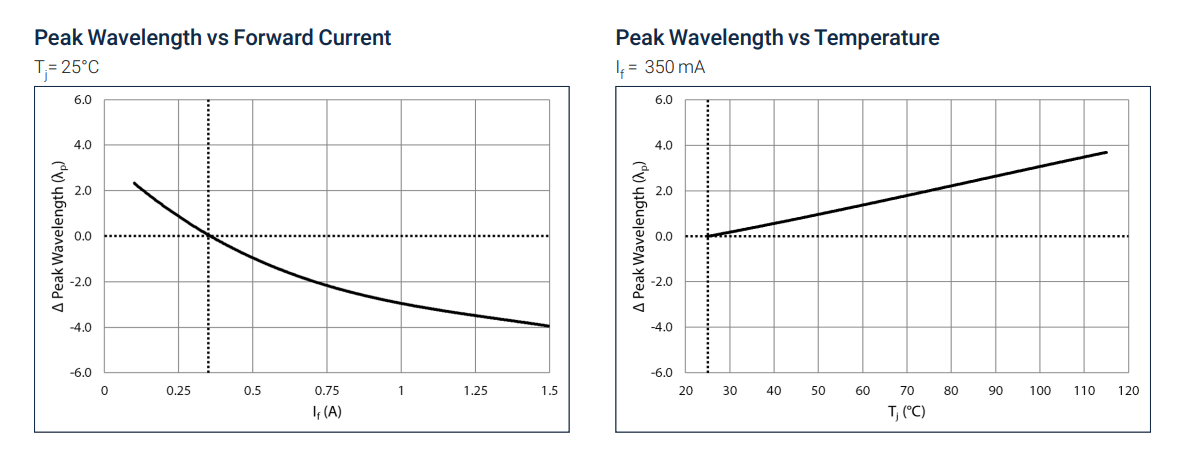
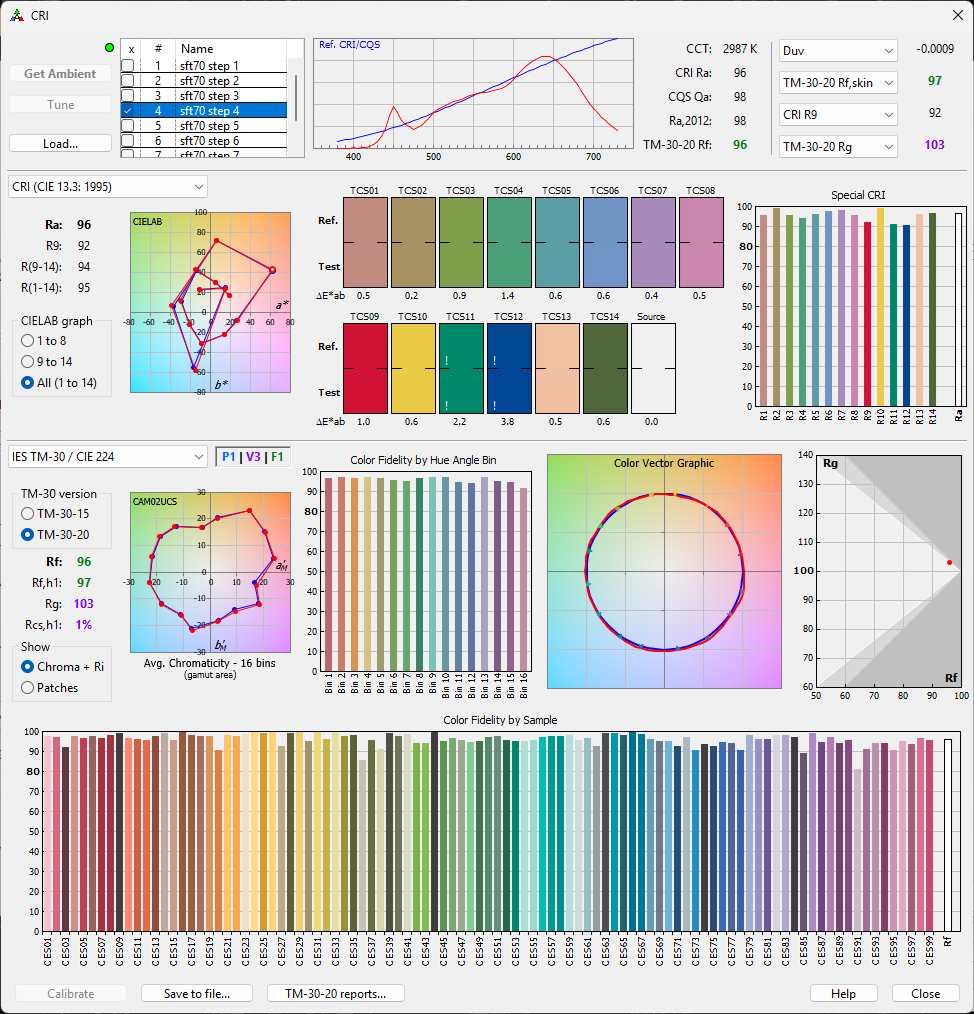
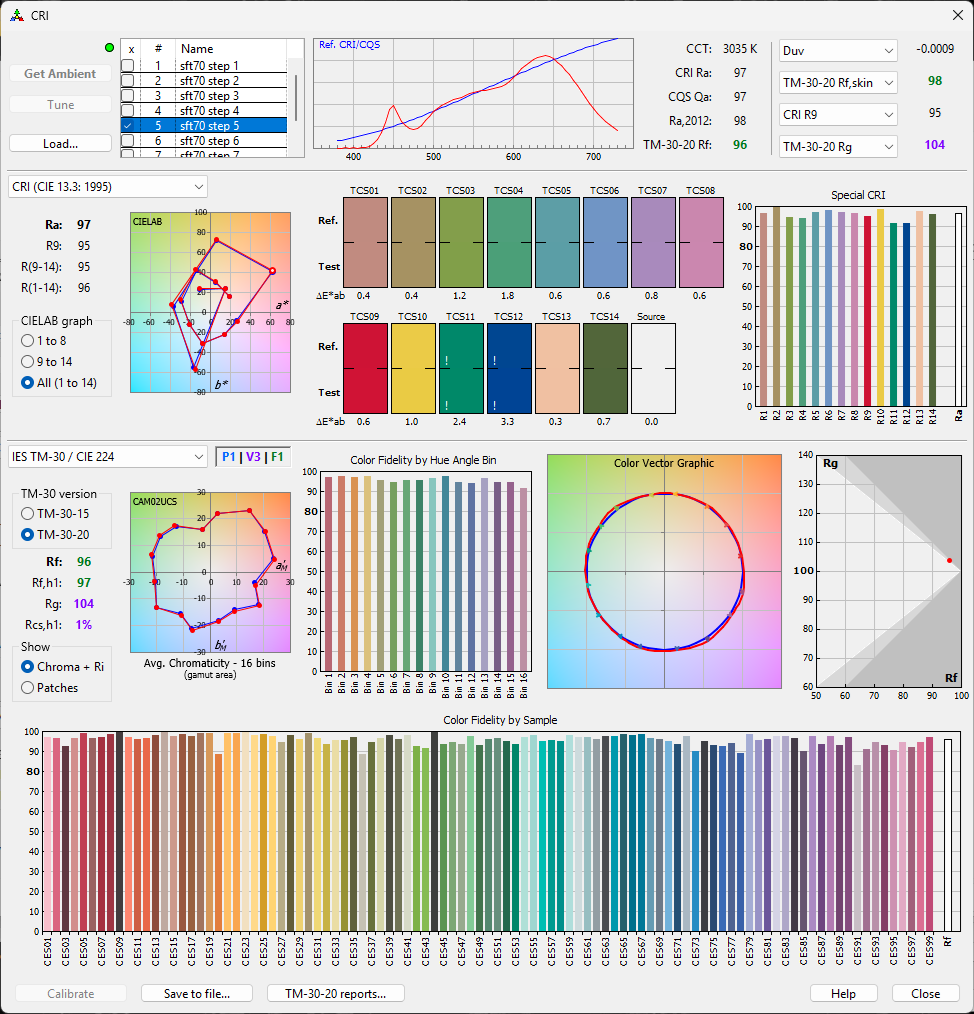
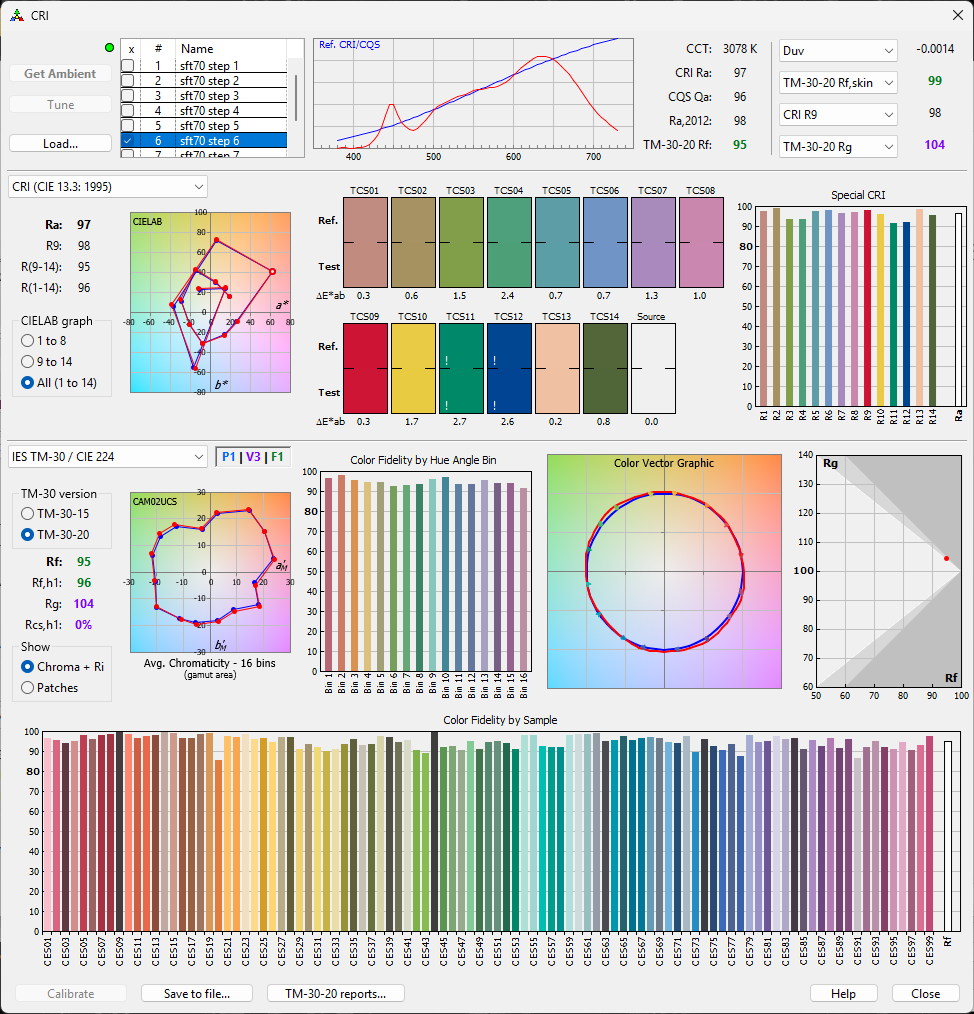
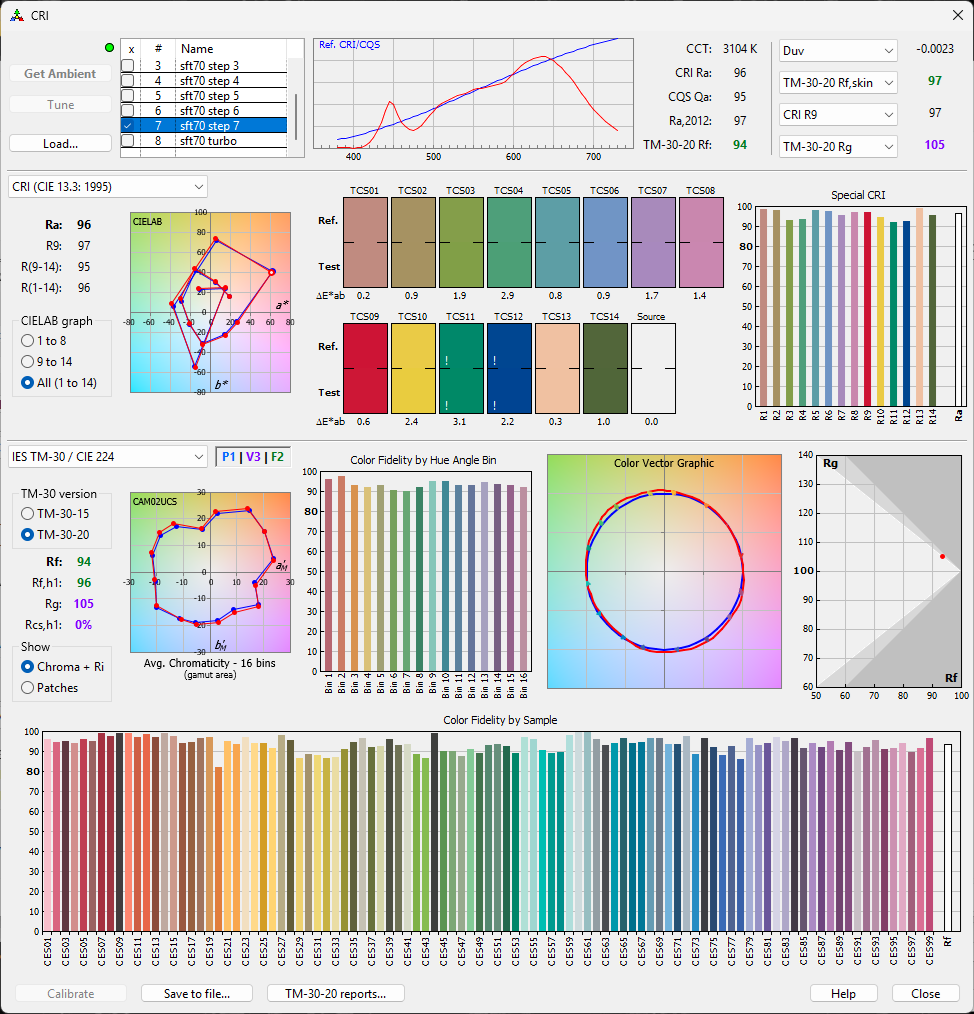
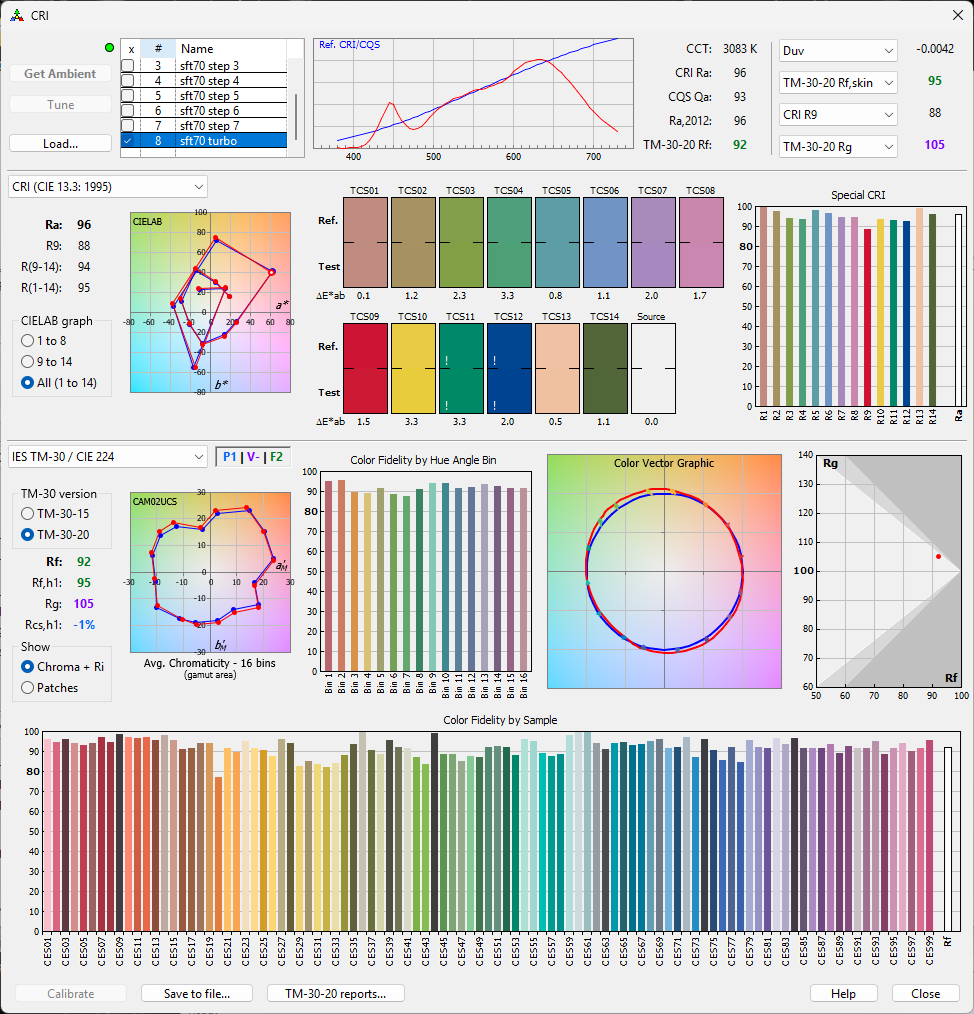
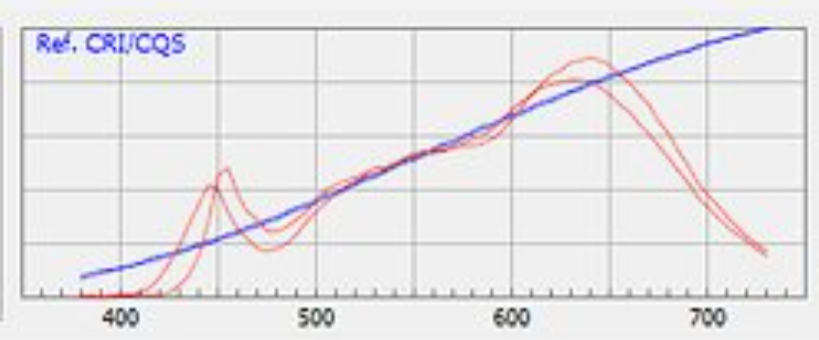
But I don’t believe this alone can explain the 10nm gap, especially as these two effects interfere destructively, and that the SFT70’s LES is only 62% larger than SFT40. Unless these plots become much greater in amplitude outside stated conditions (25C, 350mA).
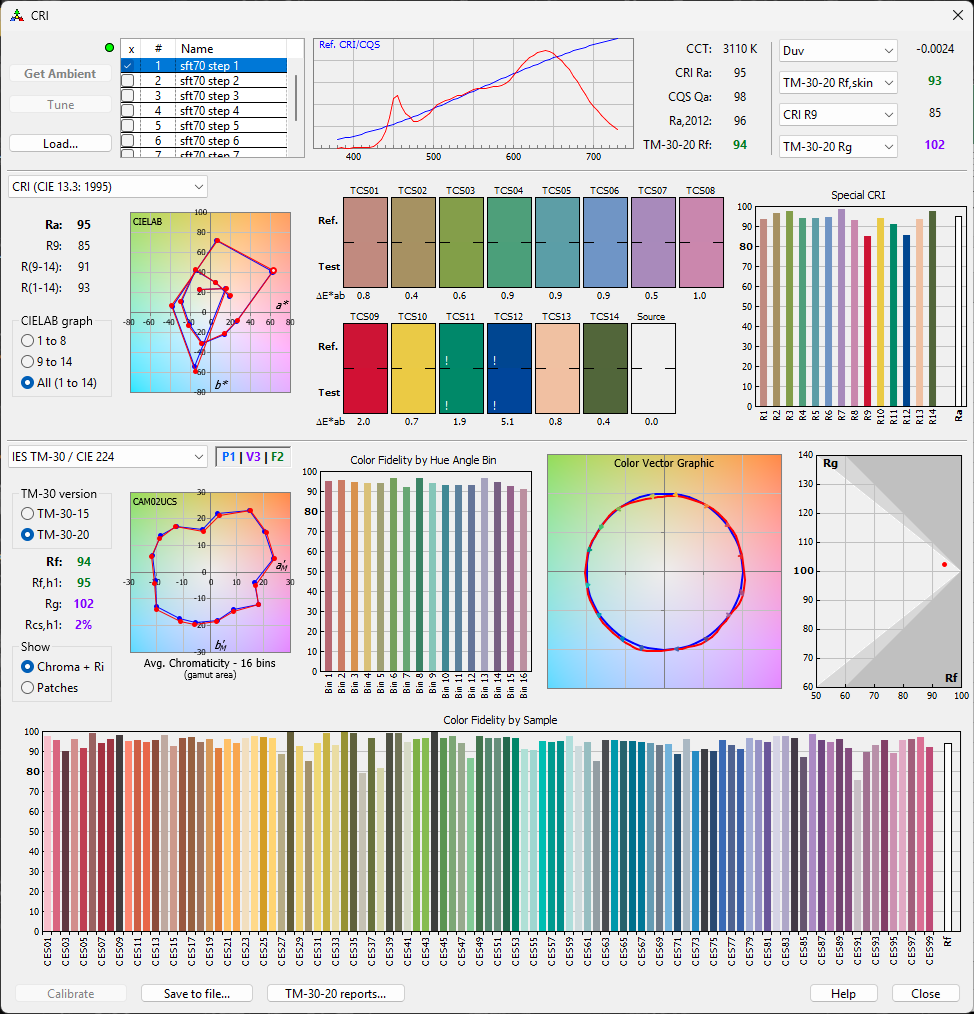
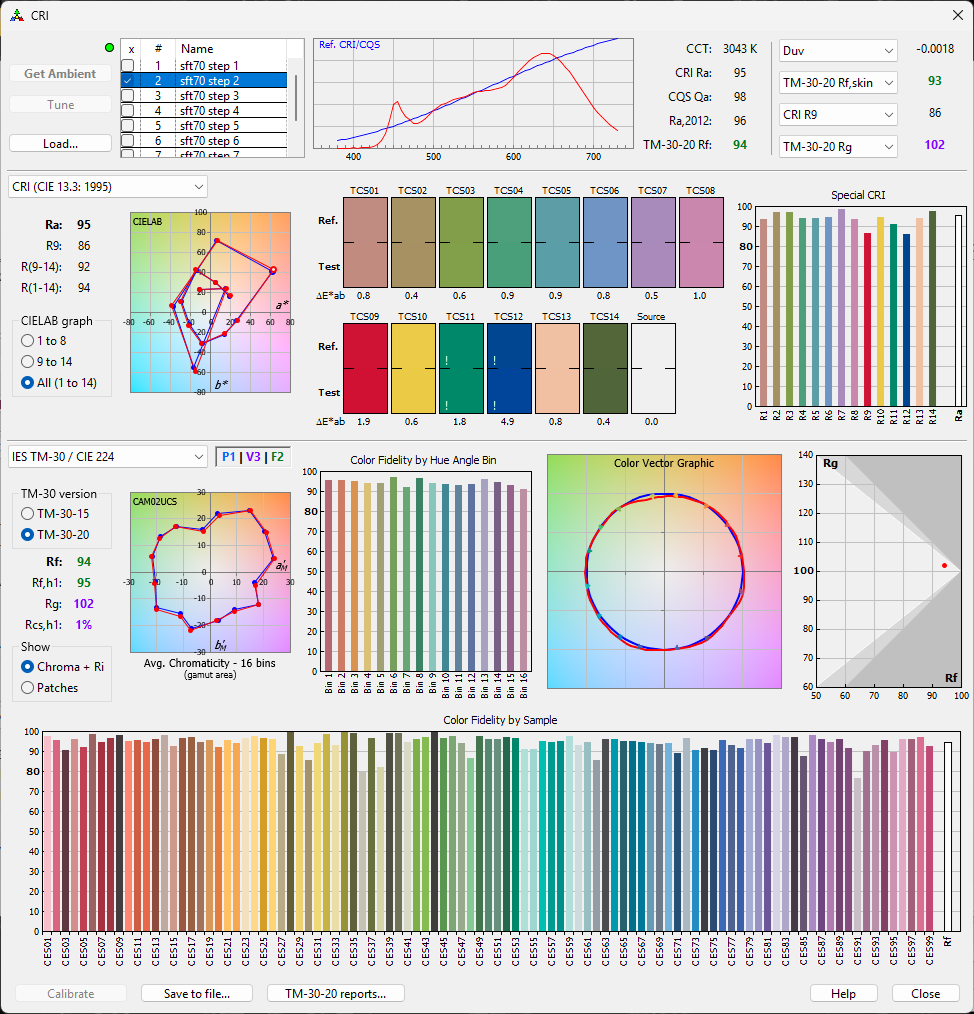
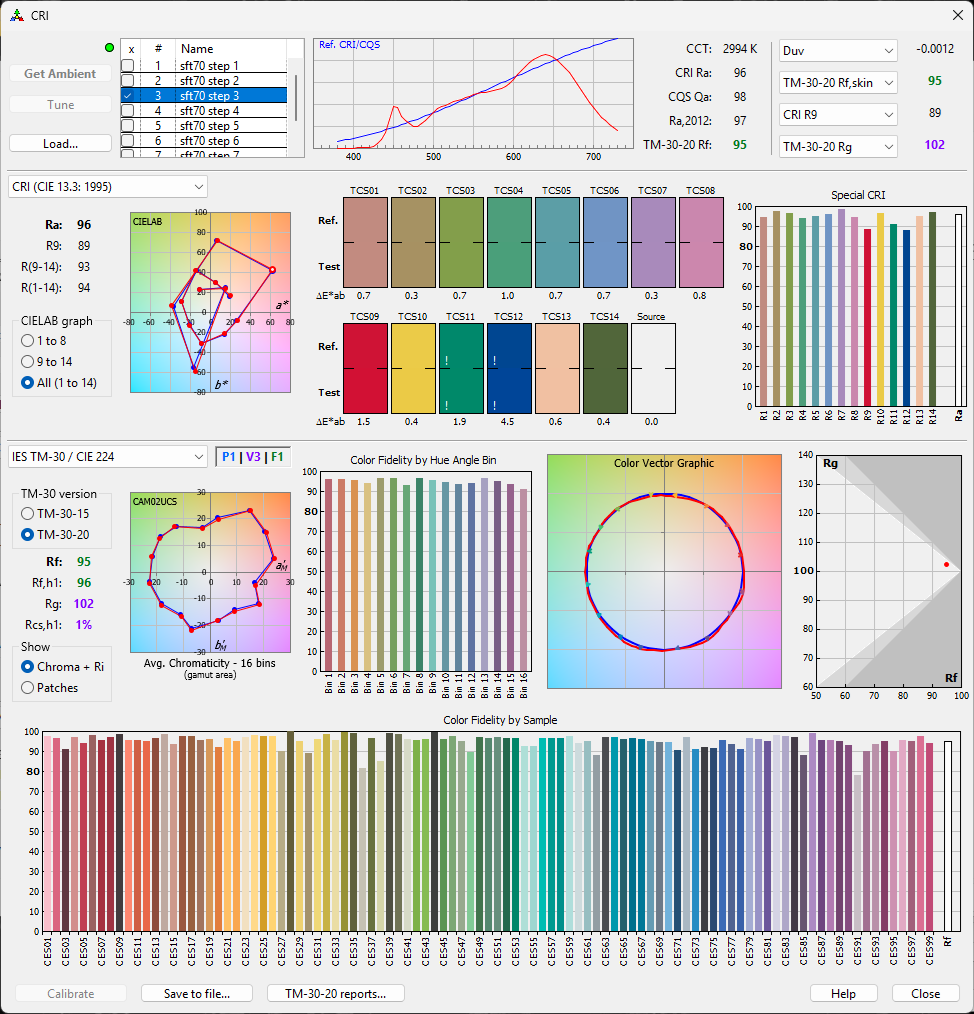
So it looks like current density does play a significant role in the peak wavelength shift. Though the difference is quite minimal between adjacent levels, so I don’t think current density alone explains the SFT40 and SFT70 difference.
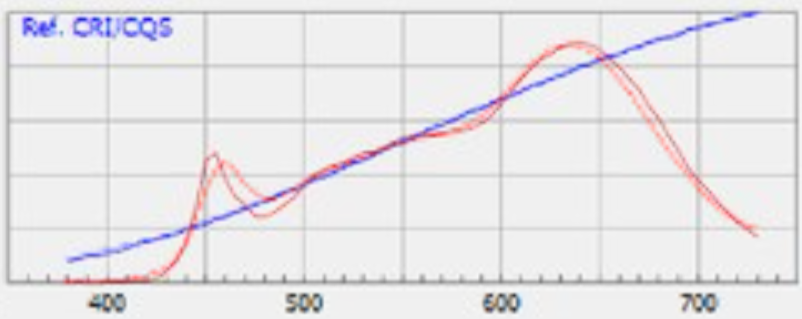
Also, there is still some difference between your level 1/7 and the sample tested by koef3. koef3’s sample has a peak wavelength 5nm even longer, with a bit less cyan dip:
I did notice that wavelength binning for blue LEDs spans a 15nm interval from 445 to 460nm; perhaps different SFT70 samples came from different bins of blue.
Oh that’s a great point, koef3 uses a bare LED in an integrating sphere while @crbnfbr presumably measured the beam from a secondary optic, so conceivably some of the spectral differences could be due to optical setup. I don’t have a spectrometer but have visibly observed how much the choice of secondary optic can influence the spectrum.
I know my using a light vs koef3 using an integrating sphere isn’t an apples to apples comparison. I was mainly trying to show the shift in the blue spike with different current.