I also have an A54 5G and while it took a couple of tries, I got it.
That said, the A54 has some Bluetooth issues in general, unrelated to Opple.
Really ? How did you manage to connect LM4 ? Did you make any specific settings ?
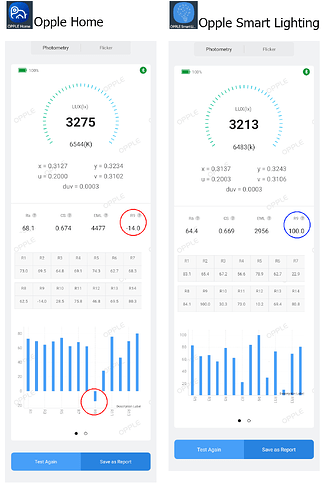
I hear Opple Home is more frequently updated. So, I installed “Opple Home” app from the Play Store to test it out. You can view Light Master readings in the “Me” menu located on the far right bottom menu. And here is how it compares with “Opple Smart Lighting” app.
One thing to note is that, contrary to the news suggesting that Opple Home is updated more frequently, as of now, Opple Smart Lighting appears to receive more frequent updates on the Play Store. Opple Home was last updated on Oct 12, 2023, while Opple Smart Lighting received its last update on Dec 5, 2023, according to the Play Store.
Nevertheless, I find Opple Home to be superior because it can display negative R numbers and doesn’t seem to report false R9 numbers. I believe Opple Home is better calibrated than Opple Smart Lighting.
Seen on the left is the new app (Opple Home) and on the right is the old app (Opple Smart Lighting).
The lighting source I used for this comparison is a COB LED I received from Wurkkos as a complimentary gift. It is a low-CRI LED with a high CCT of 6500K. These types of LEDs caused problems in LM4 within the Opple Smart Lighting app, where it falsely displayed a very high R9, as indicated in the blue circle. In Opple Home, it correctly (I believe) displays a negative R9 number and displays it on the chart. See the red circled area.
I have also noticed R9 from CSP2323 6000K (Wurkkos TS10) has dropped from 83 to 59, which I think feels right. The R9 numbers for B35AM did not change much. They were around 90 in both apps.
There is one minor downside, however. Opple Home does not report Ra and R9 numbers for some lighting sources, such as fluorescent lamps. Additionally, it did not perform well under natural sunlight (R9 around 70). I suspect that the app development team calibrated the LM4 exclusively for LEDs and refuses to report if the spectrum deviates far from that of LEDs.
all your points are correct except one. don’t just compare update date, because Light Master module is just one feature of “Opple Home” and “Opple Smart Lighting” , so the update date doesn’t indicate Light Master module is updated.
Nope. Just persistence. When it didn’t connect the first time, I power-cycled the Opple (close then re-open) and it generally hit the second time and never took a fourth try.
I too seemed to get better results, especially R9.
Any hope we could get the Bluetooth data transfer design?
Both lm3 and lm4 would be great to have the ability to read the data package directlt
So, has the LM4 surpassed the LM3 by now for LEDs?
latest update would be coming soon, you guys can test its accuracy.
btw, the channel values are in integer format, unsigned short, 16 bits, so you need to move one byte by 8 bits and “bitwise or” those 2 bytes. as for calibration coefficients, each coefficient for each channel is represented by a floating number which has 4 bytes, and it is internally represented by a union type(C language data structure), and being sent to smartphone as 4 bytes Unsigned 32-bit integer(hence you see in the second graph for each row except the first), those 4 bytes will be assembled in smartphone side, hence you get the calibration coefficients. those coefficients are just for mass produced LM4, if you do algorithm or app with your own LM4, you can just ignore those coefficients.
I noticed that the ‘Opple Home’ app was recently updated on Dec 29, 2023, and here are my observations of the updated app.
The R9 from my CSP2323 6000K (Wurkkos TS10) has dropped further down to 40. In the previous version of Opple Home (Oct 2023), it measured around 60. In the Opple Smart Lighting app, it measured 83. I am not sure if this is actually getting closer to the real R9. The numbers now seem all over the place, making it challenging to have some level of confidence.
On the bright side of things, I did not notice major changes from the measurements from my Nichia B35AM. It reports Ra >90 and R9 about 80, which was expected.
However, when I tried to measure my Wurkkos COB keychain light (cheap 6500K low CRI LED), it did not give any R numbers. In the previous version, the app was able to produce low Ra and negative R9 as expected, but after I updated the app to the current version, the measurements of R numbers are no longer possible.
I personally think the previous version was more useful. At least, I could easily distinguish a low CRI LED, but now all I see is a bunch of missing numbers.
I cannot comment on how the measurements may have become more accurate, as claimed by the app developer, because I do not have a good reference point to compare my measurements with. However, judging from the measurements of a limited number of LEDs I have at the moment, I don’t think they have become more accurate.
This is incredibly useful, thanks!
oops, noticed your opinion. don’t pay attention to “Opple Smart Lighting app” currently.
I think our current method is not always workable because it’s basically based on statistical analysis of already possessed spectra, if your current measuring flashlight spectrum approximately matching one spectrum from my spectra database, then the result would be nice or acceptable. It’s complicated to explain thoroughly.
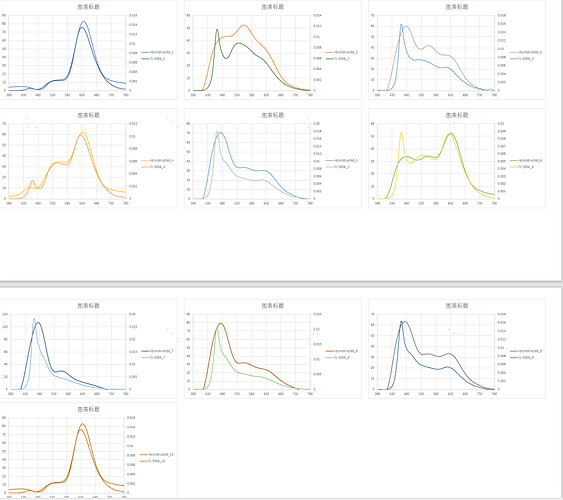
however, I am working on another method, trying to do spectrum reconstruction based on 8 VIS channels. If you get the spectrum, all metrics can be calculated from it accurately using colorimetry formulas. however, try to recover 81 or 401 points/values from 8 channel values, it could not be always accurate as your expectation too.
due to resolution of the sensor(about 50nm for one channel), the details can’t be recovered precisely, but the trend seems OK.
above is for some spectra of different CCTs from about 1800K~12000K.
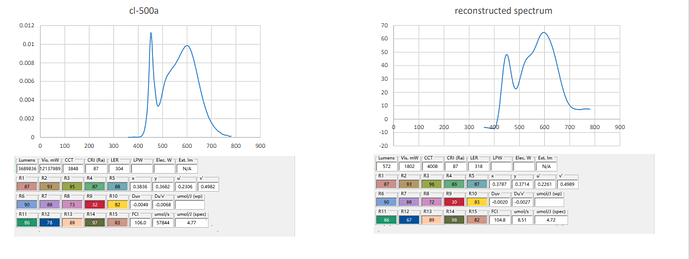
below is about 4000K office light, except for R12 seems other Rs are quite promising, so working on this method nowadays.
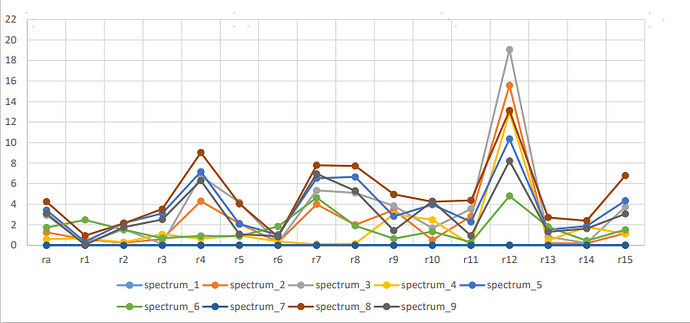
seems the R12 value(blue part) constantly behave badly. R9 error maxima is 5 based on my 9 spectra(I don’t know its precise CCT value, but range is from 1800K to 12000K), maybe you guys never measure light in such a diverse range, so I think spectrum reconstruction is a promising method. but the app UI would not refresh as quick as previous version, because using this method would take much longer time to calculate.
Thank you for providing such detailed information.
Based on your description, it seems that LM4 has lower resolution (8 channels with 50nm per channel) compared to high-end spectrometers, which typically have a 1-nm resolution in the relevant range. In this context, attempting to replicate the detailed reports of high-end devices might be futile and could lead to more problems.
I don’t believe people who purchased LM4 are expecting a full spectral density. Personally, I’m not interested in, nor do I have the ability to interpret, such detailed graphs. However, I am keen on understanding a few key indicators, such as Ra, duv, and R9. If you can reduce the number of the reported variables and focus on accurately estimating them, I believe it would enhance the user experience. Another approach could be to prioritize fitting on the key variables, aiming for a close match, and then proceed to estimate other variables. I believe users would value higher accuracy in those key variables more than an overall better fit across all variables.
Thanks steve for the hints, by any chance do you know if the LM3 follows the same basic protocol (less channels, obviously)?
I have same opinion with you, less variables but precise variables. as far as I know, duv and CCT, cx/cy and some other variables are much more easier to calculate because when you get XYZ tristimulus values, those variables can be calculated by formulas, and you don’t need a full spectral density. but for Ra/R9 and some other variables, you do need a full spectral density which as7341 just can’t get accurately.

let me give you an example, if you’ve already got a responsitivity curve/vector for F1 channel, the two curves above do dot product with responsitivity vector individually, the values can be same. and those curves can be infinite, so for one as7341 channel, it output one value for example 25, the hidden spectral density can be infinite combinations. that’s the key. in a word, x + y = 25, and you want to recover x and y, but there are infinite combinations of x and y.
if you have a more advanced spectrometer which has more channels, for example dozens of channels, maybe you can just do linear interpolation to recover the full spectral density values, and then you can calculate all variables you want. if you got a 1nm-resolution spectrometer(for example integrating sphere), calculate those variables you mentioned is quite straightforward.
sorry, I am kind of verbose.
LM4 and LM3 are quite similar in terms of protocol. but LM4 has more channels, the byte stream/sequence is quite alike.

you send this to device through serial protocol, don’t care about the first 9 bytes; and when you receive the response from LM4, forget about the first 9 bytes, and assemble the 10th and 11th bytes, checking whether it is “0x0a01”, if it is correct you can proceed to parse the remaining bytes, hope you have fun playing with it. and if you have inspiration for making Light Master behave better, please tell me:-)
Integrating spheres also come cheap with simple sensors )))
well, IS in our company is quite expensive, first it’s very big in size, the diameter maybe exceed 2 meters.
btw, I found a new Japanese supplier called “HAMAMATSU CORPORATION”, its sales person suggested a chip to me, but It cost around 1500 RMB, while as7341 from ams Osram only costs only about 20+ RMB. even we buy a large quantity, and they offer a discount, the average price is still about 1000 RMB. but surely the chip is more advanced, the resolution is about 2nm, as7341 is about 50nm for one channel, a huge difference.
For everyone, that is around $140 at current exchange rates. That would probably mean the product pricing would probably be around $200-250
It sounds to me like that is a proper spectrophotometer sensor, based on the pricing and 2nm resolution.
Do you have the model name of the sensor, or a part number?
It would make for a very good product, but I think it might be too expensive for most enthusiasts, as then there’s other options with a good reputation, like the Colormunki Photo ($150-200 used).
If it had a few features not available otherwise it would be appealing, like exporting the spectrum file over bluetooth, as well as working through USB on a computer.


