I think everybody here can install apk so it is not necessary put apk in Google Store.
2 Thanks
what about iOS platform?
I would not involve management or other Opple reps, since they could change this project in a way we don’t like. I wouldn’t be surprised if it goes this way.
1 Thank
I don’t use Apple products. But I google and find: Installing apps through alternative app distribution in the European Union - Apple Support (IS),
How to Install Apps on iPhone Without Using App Store [A Guide]
1 Thank
I think that’s only available for EU citizens since the EU forced apples hand.
Officially, maybe it is. But I see there are many ways to install .ipa . And many of them even don’t need jailbreak.
Any way apps for Windows and Android is better than only for Windows
Also if they are not signed?
I don’t know details it is better to ask Apple users. I just google 5 min and there are many articles “how to install .ipa”
chart.min.js seems not well organized.
I still can’t get the essence of it actually, wait…
I believe chart.min.js is a version of chart.js which is an open source javascript. There is a whole website on how to use the code. www.chartjs.org
Actual code that draws the graph is in cie.js it uses chart.min.js to draw the graph. I managed to alter the code to reduce the number of lines in the graph, so that must be it.
I need to consider how to translate the JS code to C++, is there any mechanism to translate automatically? I am actually not very familiar with JS although the grammer&syntax is alike
I can read basic programming code, but I am not a programmer. Unfortunately, I cannot help you with that.
One simple solution would be to draw a graph for x and y ranging from 0.25 to 0.50 without the crosshair mark using the JavaScript codes, and then mark the crosshair on the created image. If you know the exact size of the graph with predetermined minimum and maximum values for x and y, it wouldn’t be hard to draw the correct crosshair mark on the graph. Figure out the position of (x,y)=(0.25,0.25) and (0.50,0.50) on the graph, then it should be straightforward to find the position for any (x,y) point.
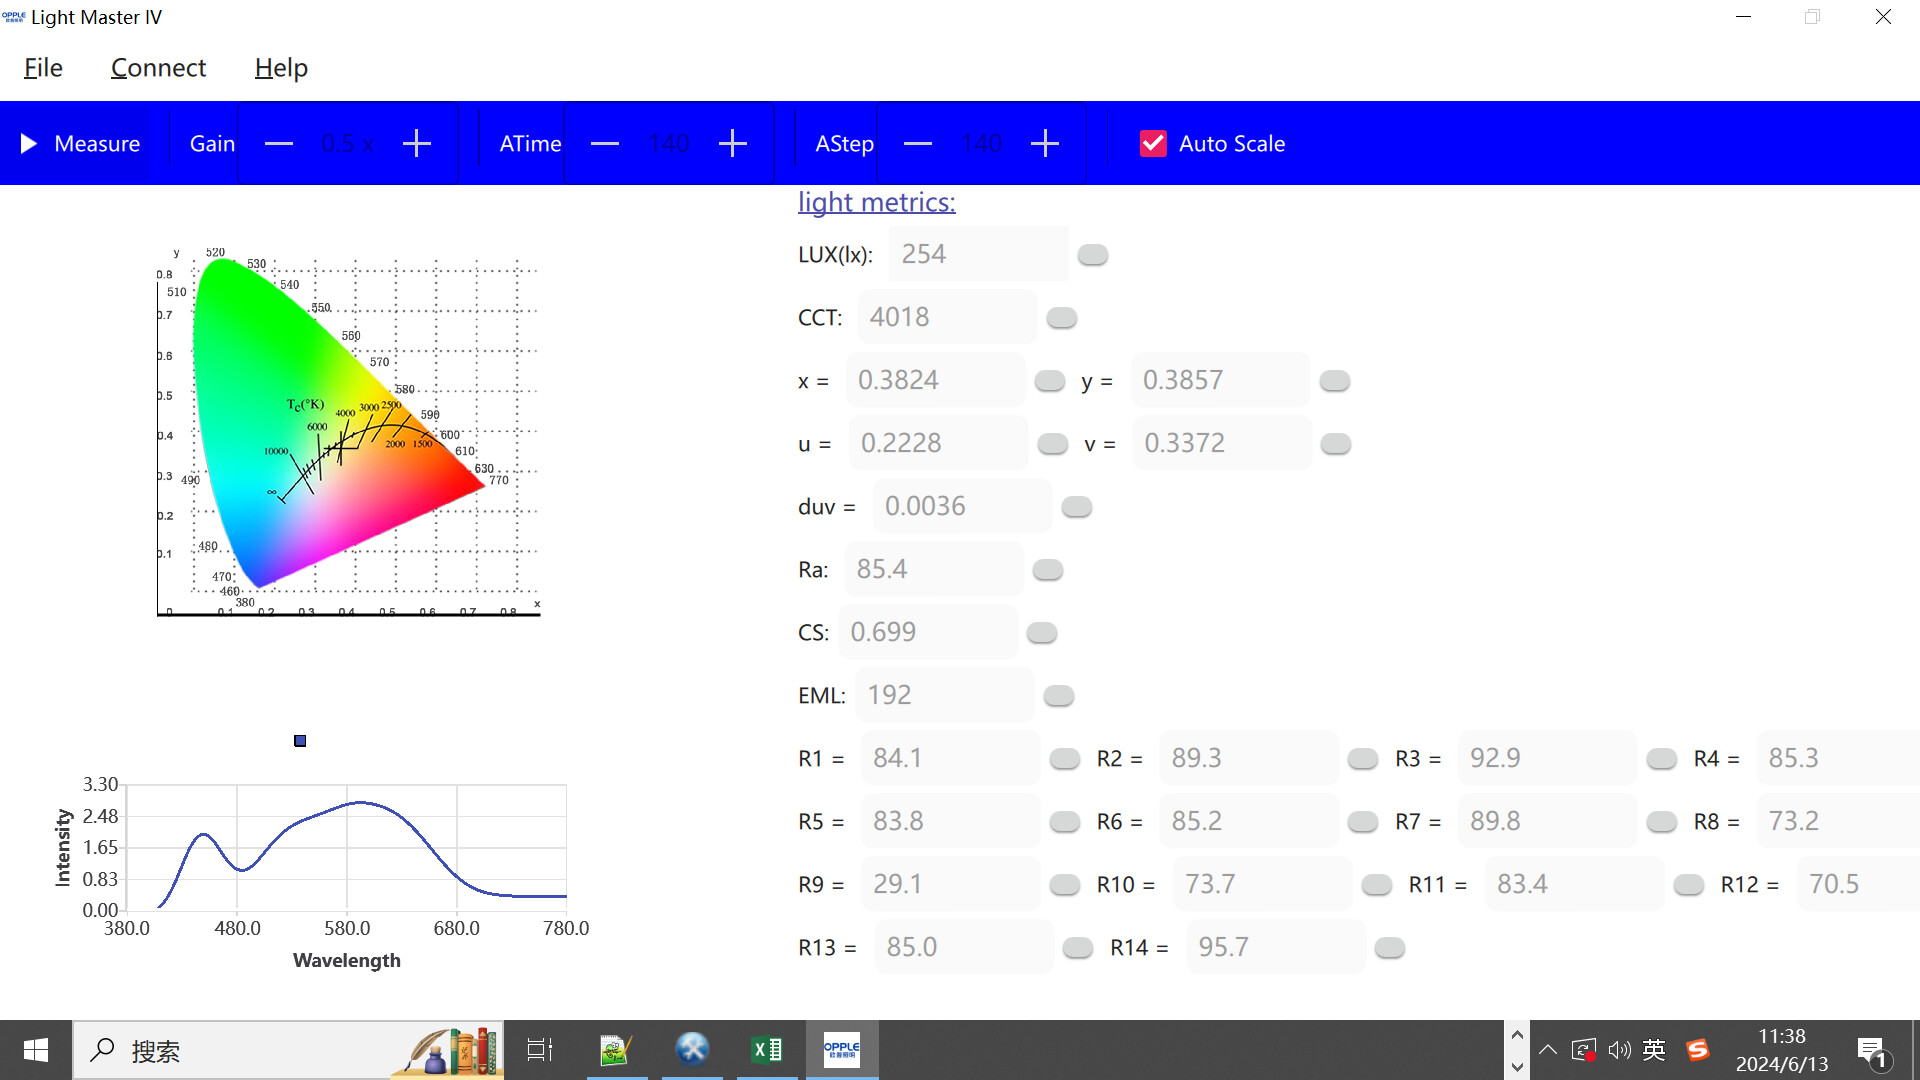
DUV was never wrong given x and y. Just plug in x=0.3824 and y=0.3857 in the waveformligting webpage, and you get the same duv=0.0036. However, your graph is wrong because the crosshair mark should be above the BBL.
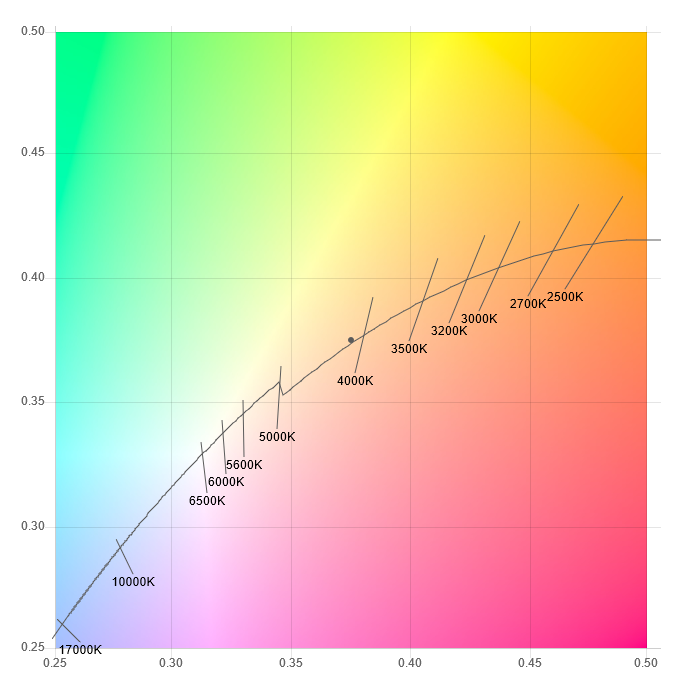
There is a 690 by 690 image file that charts x, y from 0.25 to 0.50.
The position of (x,y)=(0.25,0.25) is (55,648) and (x,y)=(0.50,0.50) is (646,32).
Say you want to draw a crosshair mark for (x,y)=(0.3824,0.3857). The position of the crosshair mark is
x coordinate (number of pixels to move right from the top left) = 55 + (646-55) * (x-0.25)/0.25
y coordinate (number of pixels to move down from the top left) = 32 + (648-32) * (0.5-y)/0.25
1 Thank
If only there were a way for people to change where a server thinks the person downloading a file is… some sort of virtual network that affected geolocation data… ![]()
my cie image’s coordinate(x,y)=(0.1,0.1) is (163,637) and (x,y)=(0.8,0.8)is((754,49), the image is (804,774), could I apply formula as below:
x=163+(754-163)(x-0.1)/0.1
y=49+(637-49)(0.8-y)/0.1
The correct formula is
x=163 + (754-163) * (x-0.1) / 0.7
y=49 + (637-49) * (0.8-y) / 0.7
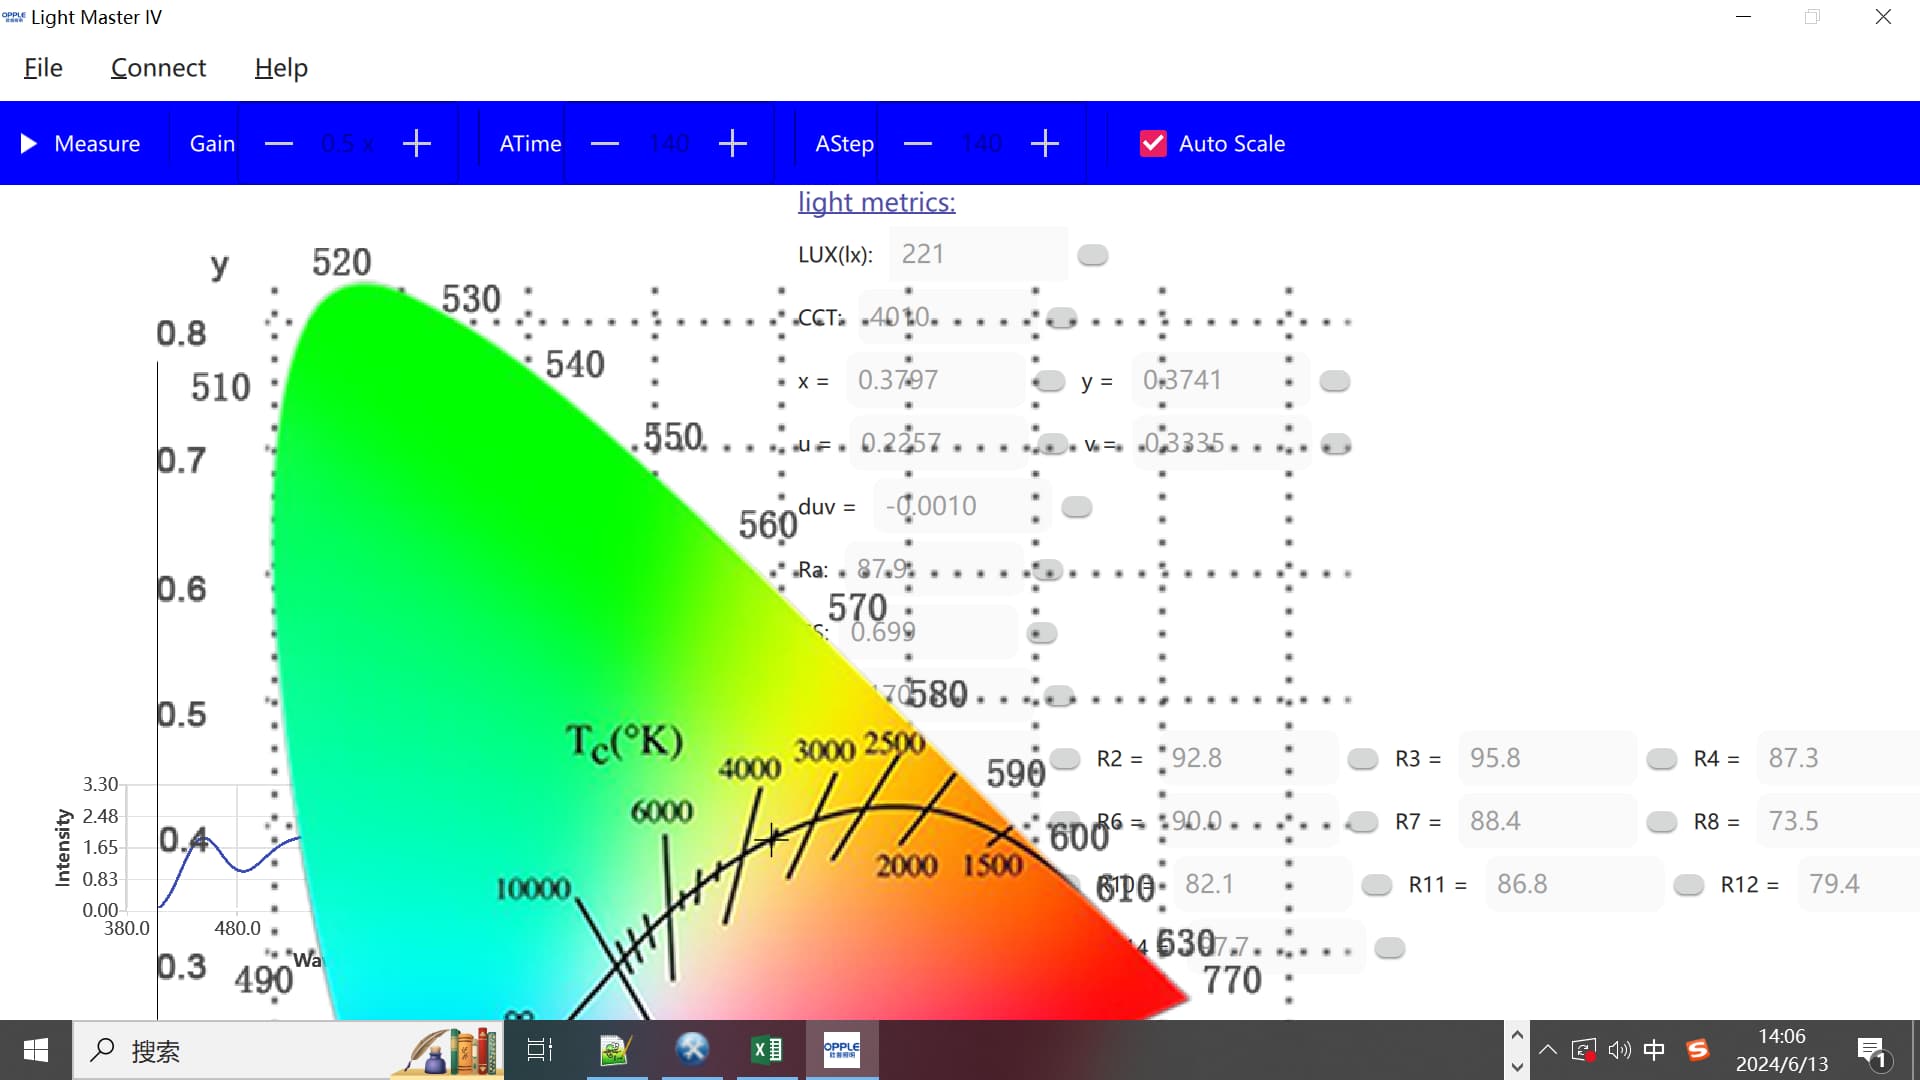
Again, displaying the ranges from 0.1 to 0.8 is too much. Not useful at all in my opinion. I strongly recommend you reduce the range to 0.25 to 0.50 range.
seems not working, I keep the image as (804,774), but later I should zoom out this image, so don’t worry about the messy layout here. but you can still see the CCT is 4010, so the crosshair is not correctly plotted.
thank you for you help@Limsup,
if you guys think his proposal is acceptable, I would use his graph. 0.25 to o.50 is enough for most cases