It seems your image is hard to pin point exact points.
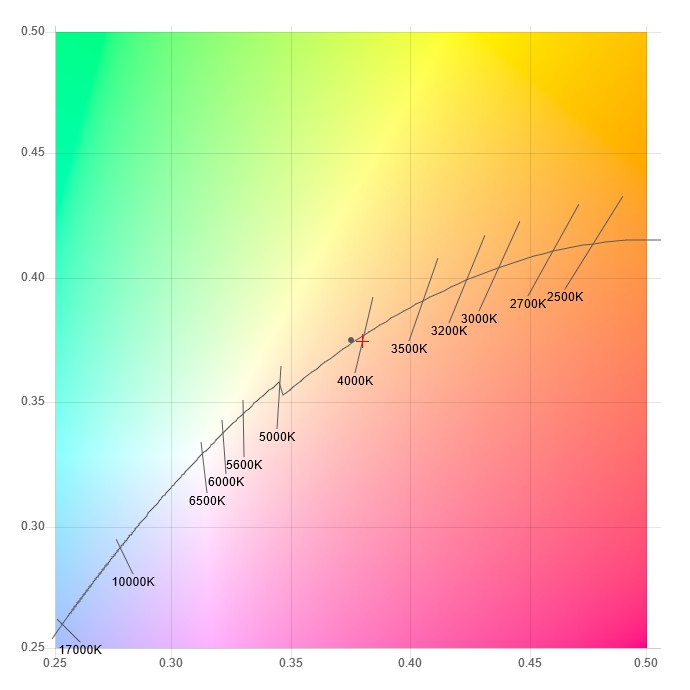
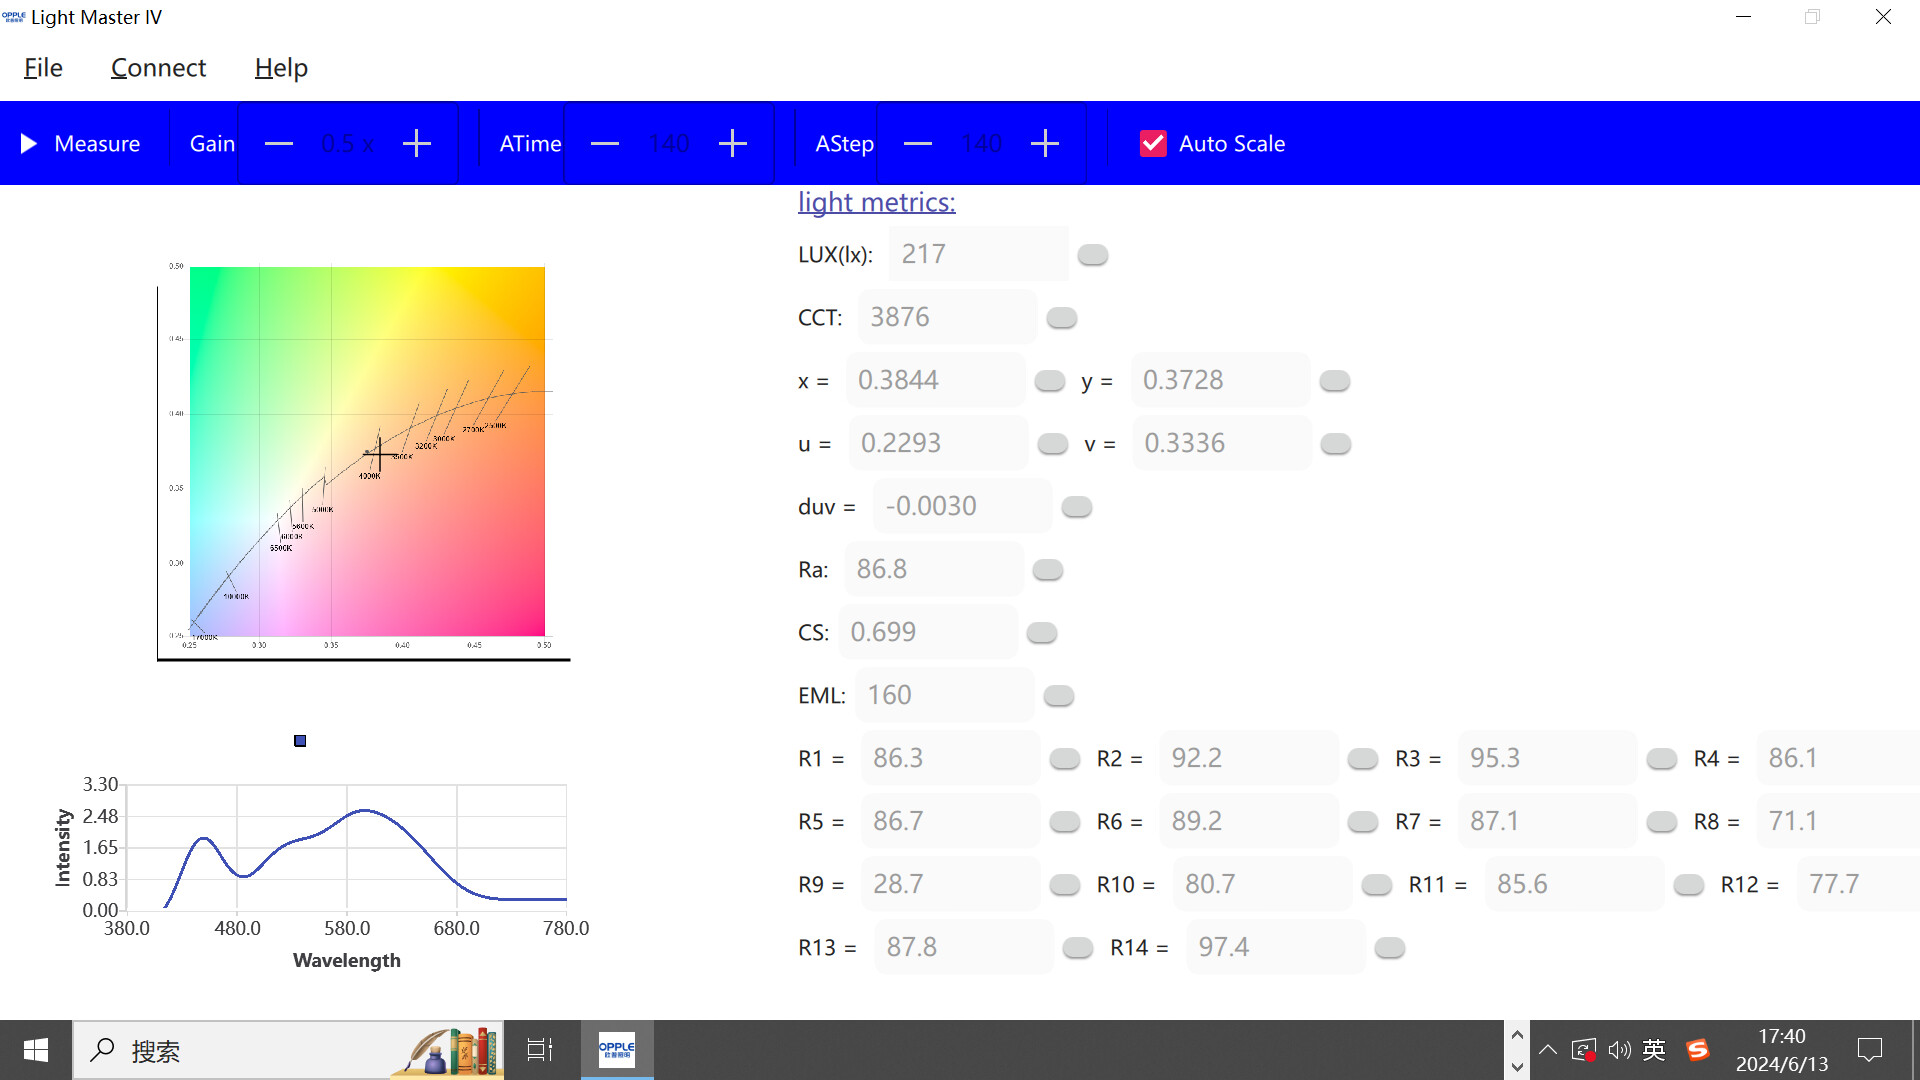
Plotted coordinates are x=0.3797 and y=0.3741, but the crosshair mark is very close to 0.4. Something is not right.
If you share the image, I can check the formula and see if your data points are correct. Before you compile the program, you can check if the formula is working by calculating a sample coordinates in Excel and check it in Photoshop or other image editing program (e.g. GIMP is free).
Before I posted the formula, I checked it in my image editing program. So, I know it works.
This was your CIE x and y coordinates: x=0.3797 and y=0.3741
Calculated coordinates on my image are:
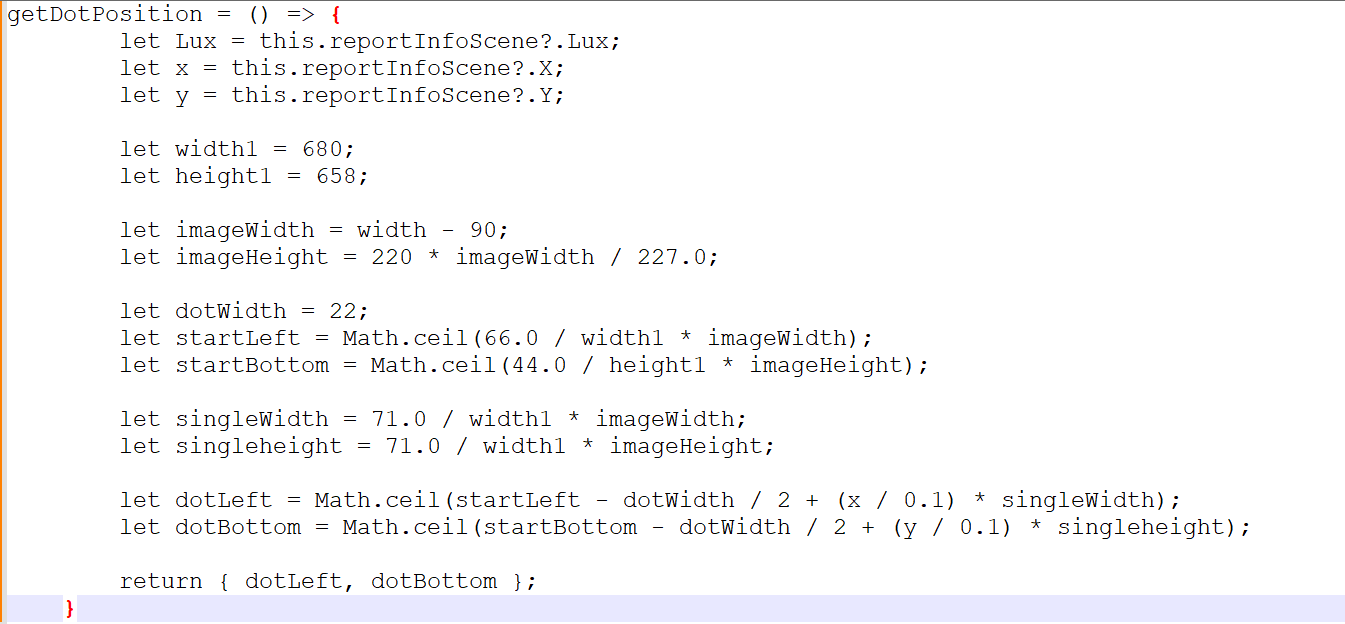
x coordinate = 55 + (646-55) * (x-0.25)/0.25 = 361.6
y coordinate = 32 + (648-32) * (0.5-C6)/0.25 = 342.2
and I have to zoom out the image when doing the real painting. the original image is too big, it would occupy much of my laptop screen, so I have to equal proportionally compress the width/height to make it fitting in my plot area, so the calculated x/y coordinates should be proportionally decreased? for example the image is 804/774, when do real painting it’s compressed to 402/387, when the crosshair coordinates are calculated using your formula, the coordinates should be divided by 2?
btw, I really want to fix the window size, I think it fits well on my laptop, it would most probably fit on other screen(your screen is much larger than mine), the layout is a headache.
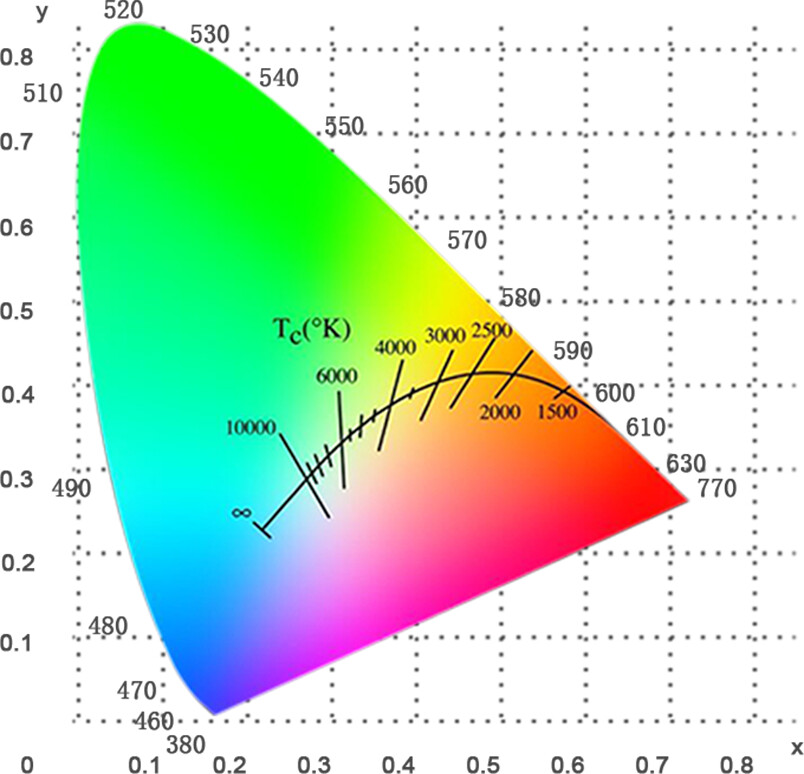
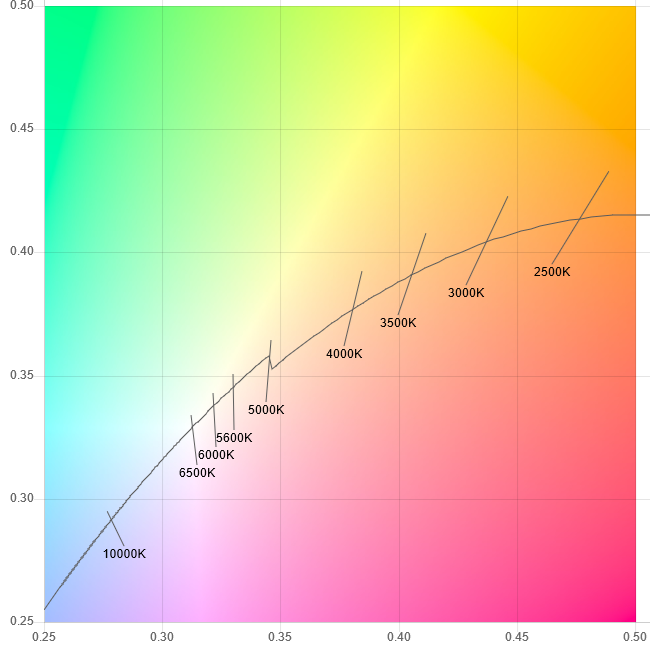
I tried your image and starting from (0.1, 0.1) and (0.8, 0.8) doesn’t seem to work.
Instead, I used the following two points as reference points.
A. where 4000k line meets the bbl
B. where 3000k line meets the bbl
I found cie x and y coordinates of our points A and B from waveformlighting webpage. CIE x and y for A and B are:
A. (0.3805, 0.3768)
B. (0.4372, 0.4042)
The corresponding image positions are
A. (391, 404)
B. (439, 381)
Using the two points and using the same formula, the formula of the positions for cie x, y coordinates are:
A. 391 + (439-391) * ( x -0.3805) / ( 0.4372- 0.3805)
B. 404 + (381-404) * ( y - 0.3768) / (0.4042 - 0.3768)
Using the formula, I put in your cie data points (0.3797, 0.3741) and I get (390, 406). Here is the crosshair mark I drew in GIMP. I think it works well.
after the UI thing, I’d think about how to make it more accurate. seems spectral reconstruction failed on halogen lamp according to my tests before.
btw, you can try “save to Excel” feature, the spectra would be saved in Excel file, when you plot the spectra curve in Excel, it looks different with the windows app, I think it’s caused by height/width ratio settting.
Thank you for implementing my suggestion. I think the app looks much nicer with the new graph. More importantly, the graph seems to be working correctly. The image appears to be smaller than optimal on your screen, but I think it would look better on larger screens.
By the way, why are there black lines around the left and bottom edges of the graph? Did you put it there on purpose?
The black lines are awkward. The graph image already has x and y axis with labels. Why draw additional black lines? If the lines do not have other purpose, I would prefer getting rid of the black lines.
OK, I’d remove it.
hope to fix all the bugs you found, and release it as v1.2.
perhaps ssi(spectral similarity index) to be added, really hope to use advanced chip, the chip is limited in channels, only 8, too few compared to other professional devices.
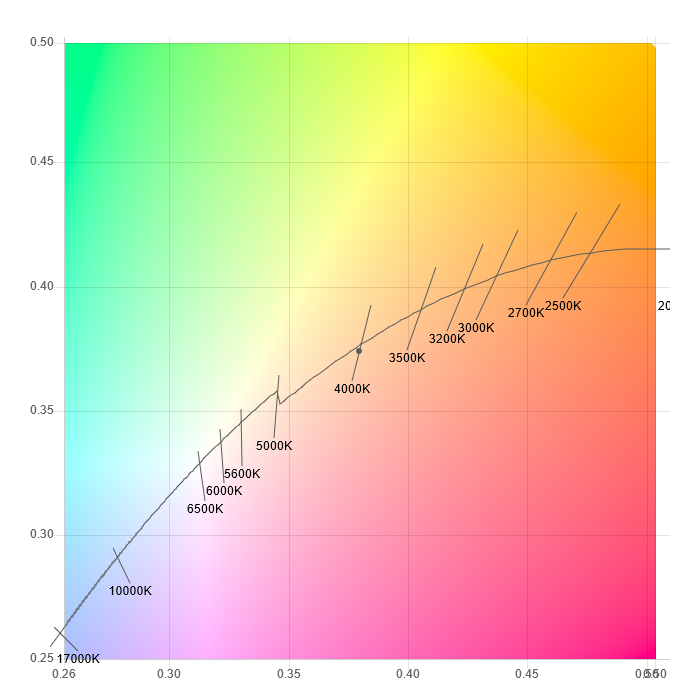
Here is the updated image file with the same dimensions. This image does not have the dot in the middle. I removed some CCT lines as well. I altered the javascript from waveformlighing webpage to create this image.
I created two images: one large (650px) and one small (400px). The larger one is the same image as the one I uploaded before, but with less margin. The reference point coordinates have changed, so if you use the new image, you should update the formula accordingly. Below, I have included the formulas along with the positions of the reference points for each image. I hope you find them useful.
1.faster.
2.chromatic coordinates crosshair plot correct now.
3.spectra intensity is more reasonable now.
4.save to Microsoft Excel supportted.
5.copy and paste.
6.UI layout basically correct, fixed window size.
7.ssi(spectral similarity index) measurement support.
@Limsup thank you for your help. btw, the app became slow after you clicked some 40 times, I think it’s caused by saved Excel file, I need to open the file and append record at the rear row, and when the records become large(for example, dozens of rows), the app becomes slow. Now only if you explicitly designate the saved file path and name will it write the Excel file to HDD.
Could we maybe get an option to automatically acquire & save to excel in set intervals? So I can for example have the LM4 take a measurement and save it every 10 seconds?