Colorimetric comparisons among spectrometers (taken from reddit)

This is just a copy of user Wormminator’s post here, with minor reformatting. I don’t trust reddit to keep it up forever and find reddit posts difficult to search for, so I’m making a copy here on BLF to make this remarkable work more visible.
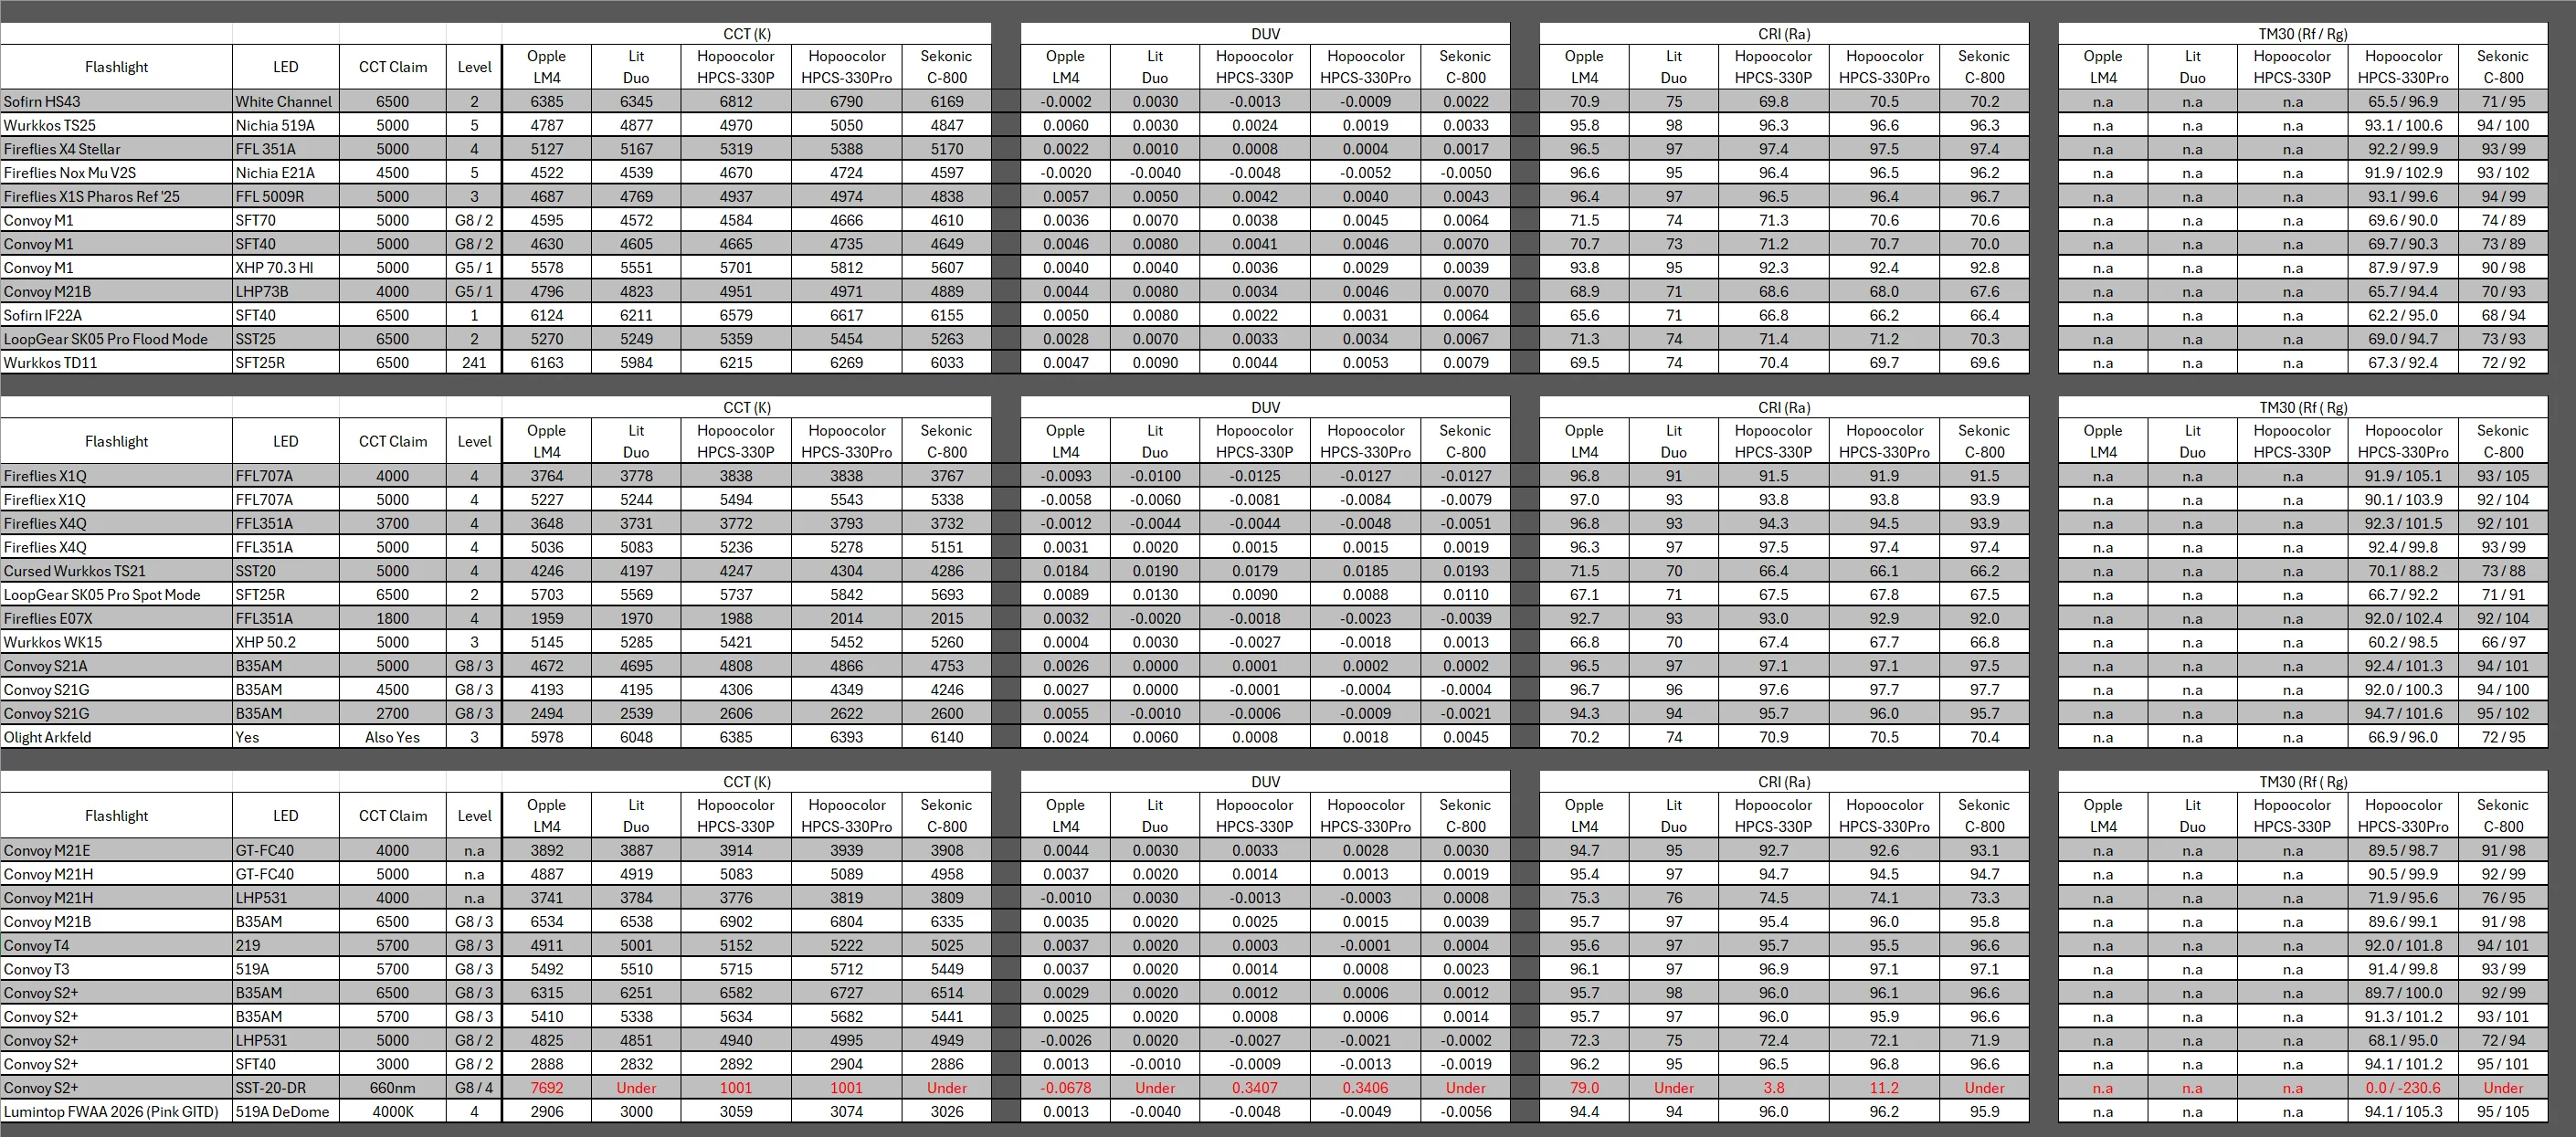


This chart is not intended to compare different emitters or lights, it is intended to show the (sometimes major) differences between five spectrometers:

  • Opple Light Master 4
  • LitDuo (0.9 beta 4)
  • Hopoocolor HPCS-330P
  • Hopoocolor HPCS-330Pro
  • Sekonic C-800

The brightness was set to the declared level to not overwhelm the poor Opple. I used a tripod + claw to hold each light in a fixed position for comparable measurements. Roughly 215mm away from the sensor.

DUV measurements were rounded to a 4 decimal place format. In the case of the LitDuo a 0 was added to the end to match the rest. I have now expanded results to include TM30 (Rf/Rg) for the HPCS-330Pro and the C-800. Further additions are the LitDuos 0.9 beta 4 firmware and the aforementioned Hopoocolor 330Pro.

This chart is a reboot of the previous 3 posts. Almost the same lights, replaced one and did minor modifications to some between the last post and todays.

Since I have re-measured the lights again, this chart IS NOT comparable with the previous 3 versions. These are new sets of data, taken at possibly different distances and slightly different angles, with different brightness levels.

The important piece still remains: The difference between each set of the same measurements.

Previous rounds:
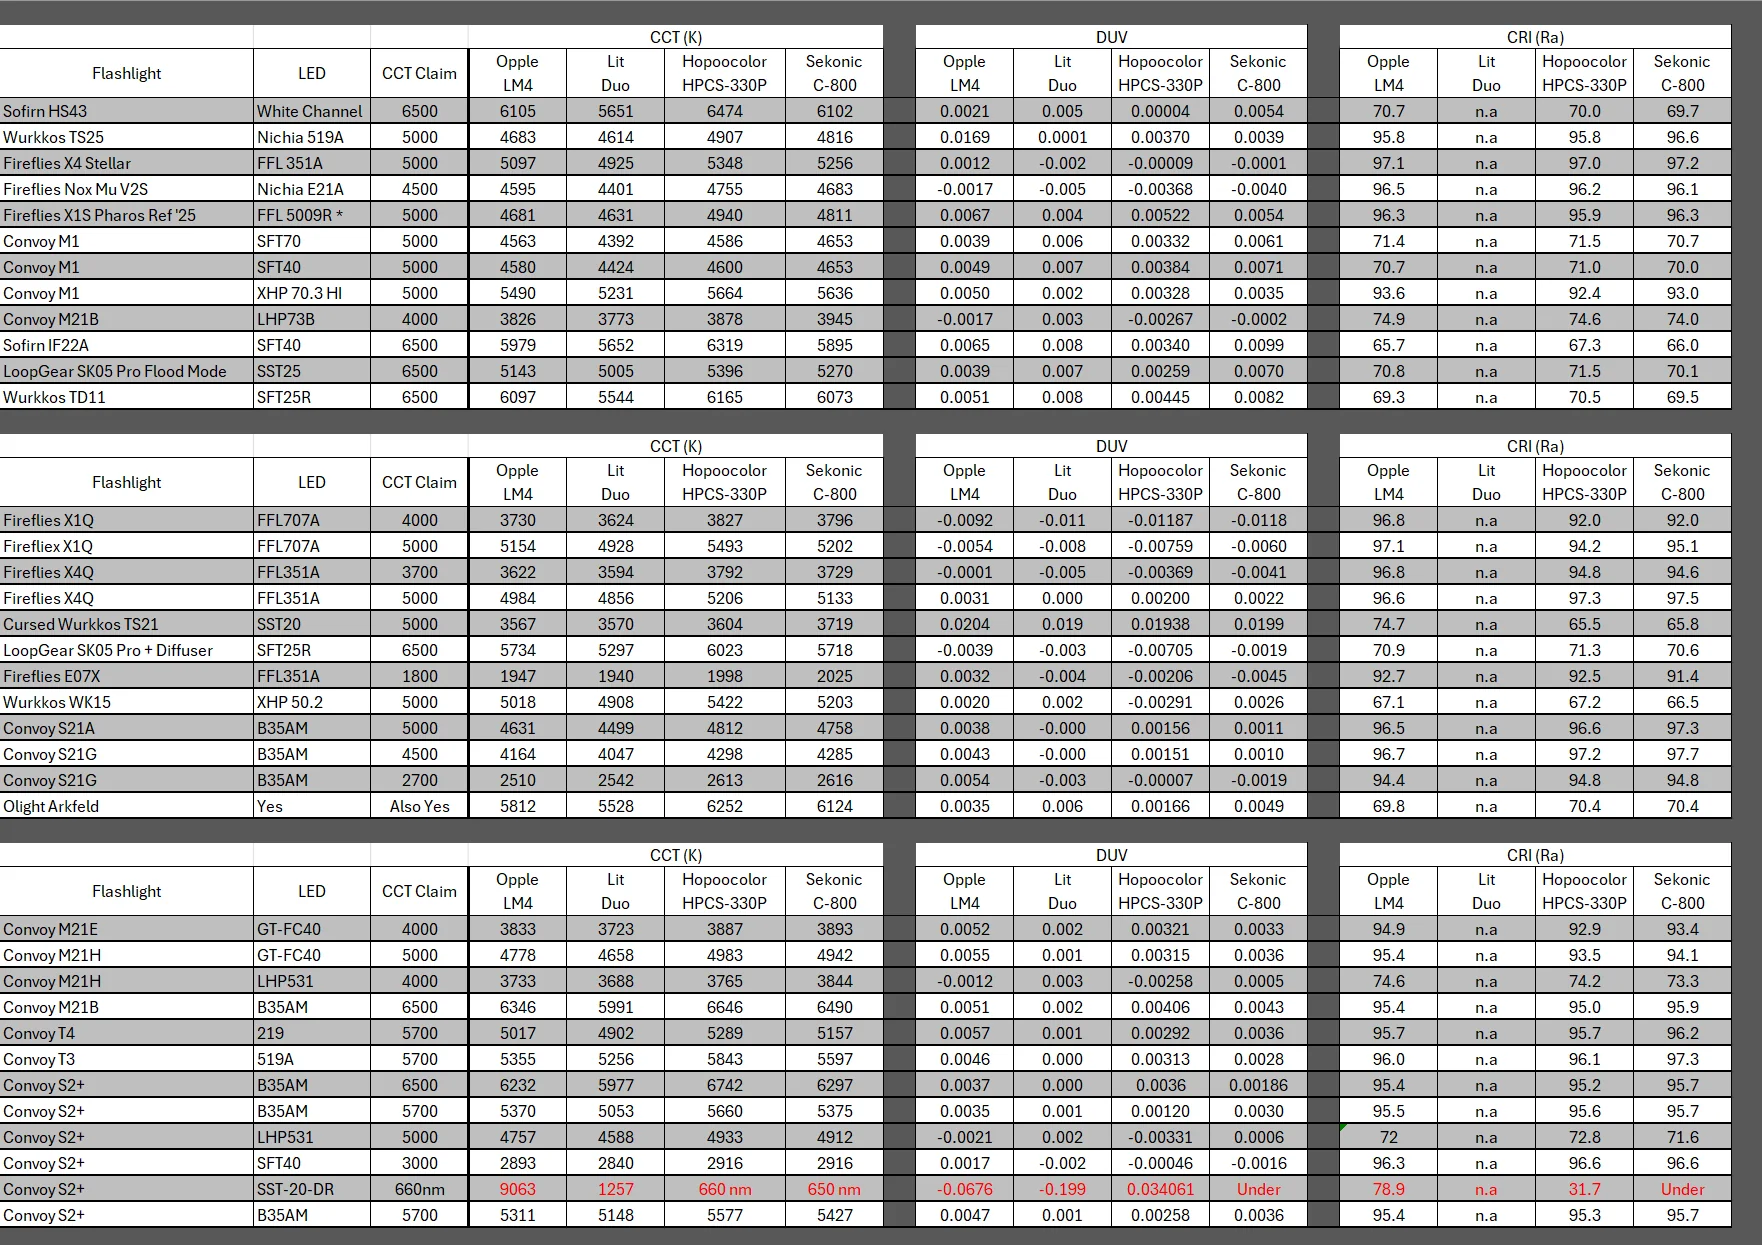
A few notes:

The LitDuos DUV measurements seem a bit off. A lot 0.0020 and 0.0030 results. Overall accuracy seems to be improved though. I am not convinced that it is accurate. 3 other devices disagree with it regularly while agreeing with each other.

High CCTs result in quite the gap between all units, while the lower the CCT gets the more every unit agrees with each other.

I have no idea if this is useful to anyone, so only one more round is planned once the 1.0 version of the LitDuos firmware is released.

I also can not tell anyone if any of these are “worth it”. For a rough idea the LM4 is still fine. Anything else is up to you. I would not recommend buying a spectrometer. But if you want one, this chart may help you.

I happened to find a few spare hours of time so figured I may as well do this now.
I just hope I did not miss anything as Im constantly tired. This is a re-post of an earlier attempt. Corrected 1 mistake (thank you excel and your CONSTANT need to change the users input WITHOUT any prompts) and also because reddit assumed that resolutions above 240 horizontal pixels are not important.

Thank you for reading and hello BLF,

-Waldherz
1 Thank

@mcjtom has performed extensive statistical analyses on the newest batch of data to make it more visual and interpretable: Brand-new comparison of 5 light meters, reporting tint/Duv using 35 flashlights! - #2 by mcjtom

Some related threads with statistical analyses relating to this dataset and previous batches:


On a personal note, I believe there is much to be learned by comparing across batches of data, against OP’s advice! Variation in measurement methodology also results in noisy readings just like variation among devices or among LED samples; for this reason, I think it should be accounted for when evaluating the credibility of any reading.

In my limited experience the Spectrometer needs to be recently calibrated to a known Black body source for Duv values to be exact.
Also the measurement setup is super critical. so some sort of integration apparatus is needed and not just pointing the light at the instrument.

1 Thank

Strongly agreed. For these and various other reasons (e.g., CRI being a poor metric for subjective spectral similarity to the reference source in my experience), I’ve learned to take colorimetric readings with a grain of salt. Most users likely measure in a much less controlled way compared to the author of this comparison, so the variation is even greater.

Nowadays I rely on eyeballing spectrograms to assess similarity to the reference spectrum (blackbody or sunlight), which has served me better than reading test numbers. Some key features are quite robust to noise (measuring hotspot vs spill, drive current, optic type, meter used, etc.), including

  • Red content: does the spectrum dip below the reference around 650nm (R9>80) or noticeably before (630nm roughly indicates 50 R9)? Does it have a bump above the reference just before, indicating oversaturation?
  • Cyan dip: how deep and wide is the cyan dip, and is it centered closer to blue (good) or green (bad)?
  • Blue spike: how high is the blue spike, and is it centered closer to violet (good) or green (bad)?

Once these features are assessed, and CCT/duv estimated, there is very little variation left. This is because most phosphors emit in a broad range of wavelengths, which prevents pathological/spiky behavior in the emission spectrum aside from those assessed above. There exist exceptions, but they are not found in mainstream flashlight LEDs.

Fully agree!

The more I learn about CRI and color science, the more I hate it.

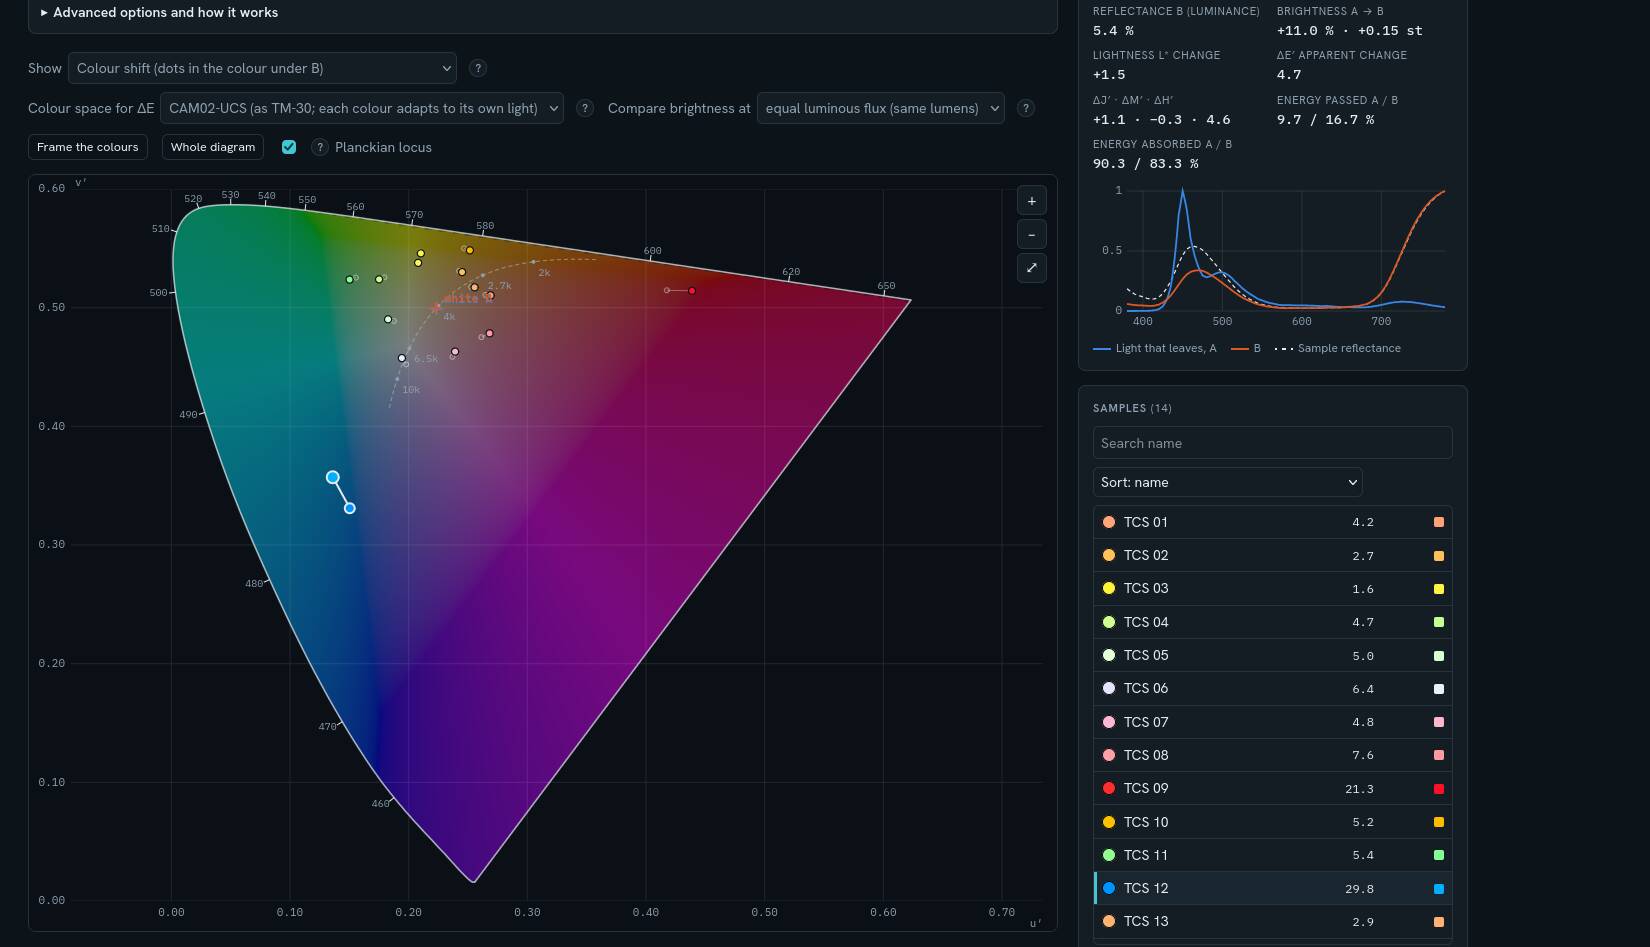
Please excuse me for using this as a shameless plug for my little tool, which helped me understand it better: Spectral Colour Test Lab

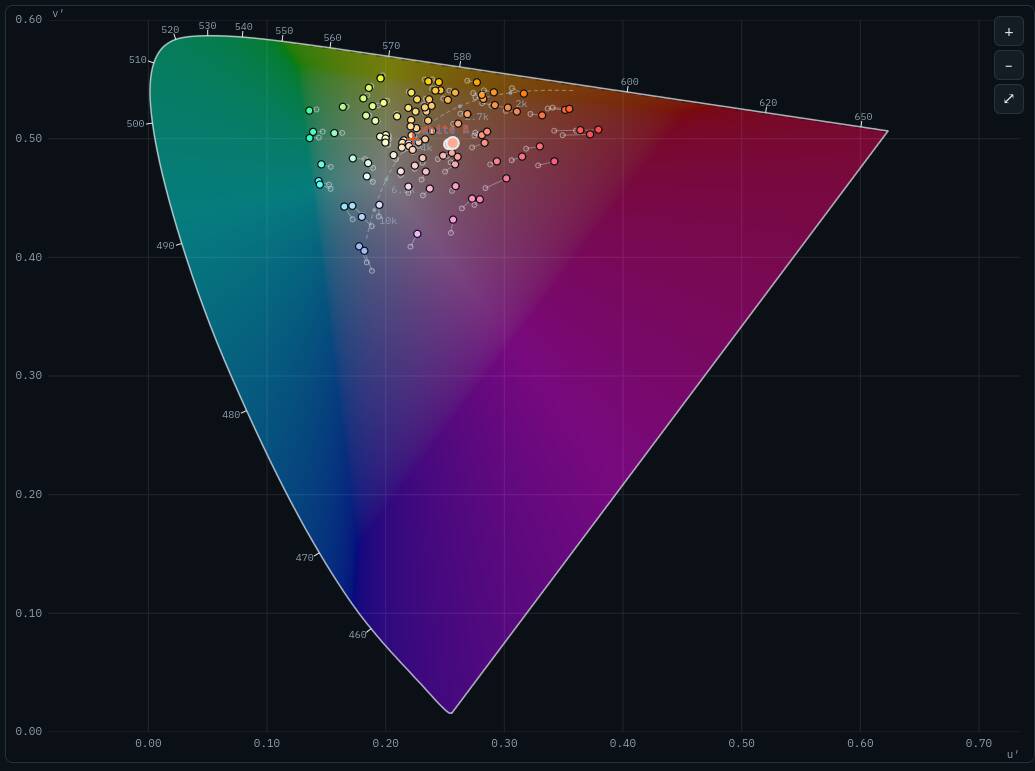
These are all the CRI color samples (at 2700 K):

This tool plots them on a chart and visualizes how they move when the illuminant changes.


Notice how there is only one blue sample, and it’s not very saturated (and it’s not part of the original nine).

Basically, there are no cyans, magentas, violets, and so on.

Here are the TM-30 color samples for comparison:


Sure, there are more of them, but look at the tiny area within the visible gamut that they cover.

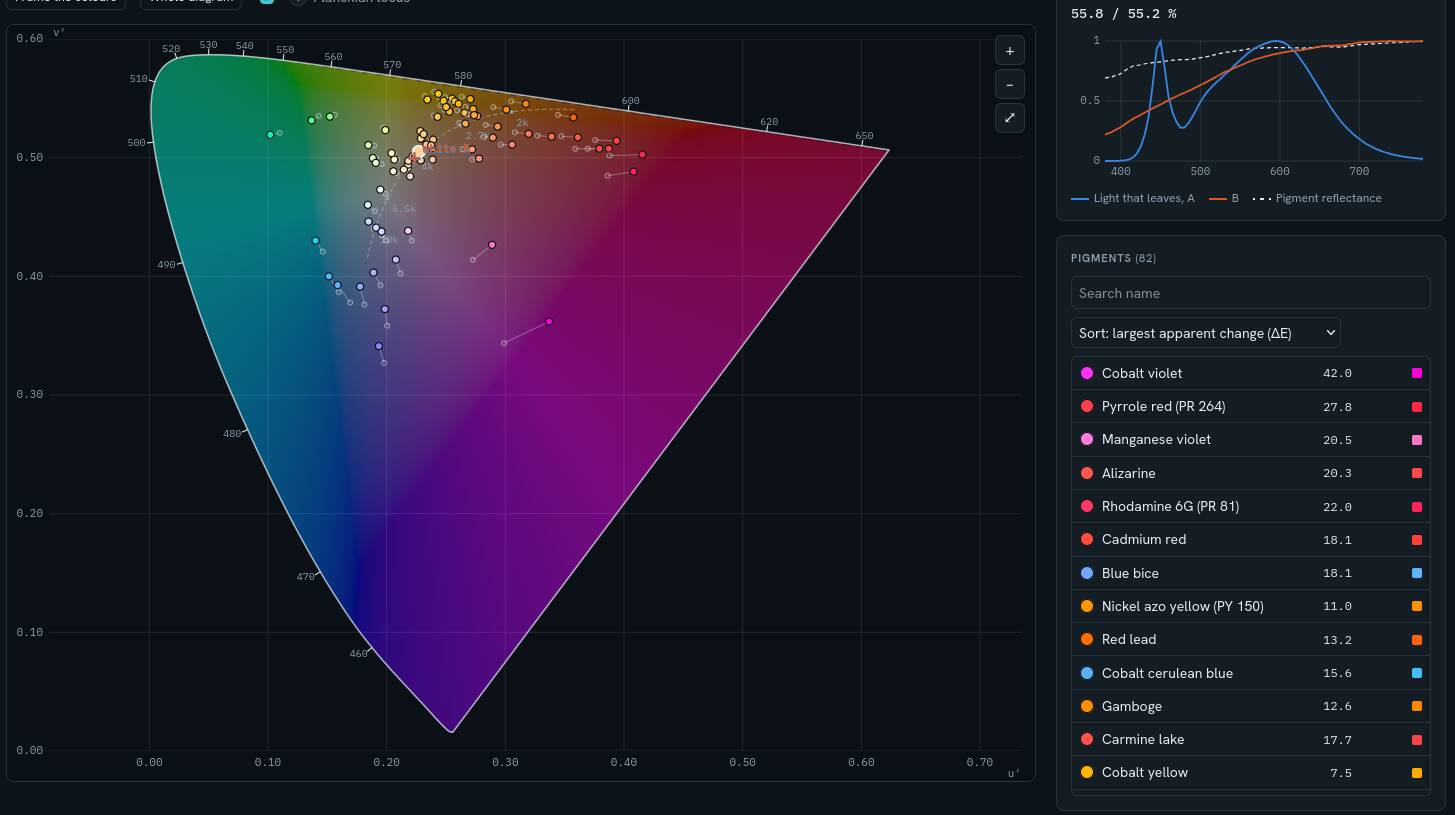
And now, let’s compare this to some real-world pigments historically used for painting:

Not only is the gamut much bigger, but the colors also tend to shift more!
" real-world colors are inherently more vulnerable to metameristic failure than the artificial, smoothed, or averaged test color samples"

It’s kind of frustrating, but this is also what I tend to do. I would much rather have a simple, quantitative metric I could point to when defining fidelity, but in my experience, there’s no substitute for actually looking at the spectrum.

I’ve implemented a similar set of metrics, along with automatic measurements, in the latest version of my other tool: LED Spectrum Lab

However, I’ve been somewhat hesitant to release it with my somewhat artificially, non-standard measurements. I’m afraid they might cause more confusion than they help resolve.

1 Thank

thank you
that is a very useful comparator of various tools

I have noticed that my Opples 3 and 4 dont agree with each other on CCT, CRI, nor DUV, and they are especially inconsistent with cool white Low CRI LEDs

the more expensive tools tend to agree on CRI, but they dont always produce the same CCT and DUV. Here is an example from the first line of the dataset..

note the Hopoocolor reads CCT 10% higher, and varies by 0.0035 DUV points, compared to the Sekonic.

I point this out to show that there is no absolute accuracy, no matter how much the meter costs.

1 Thank

Not shameless at all, it is relevant to the discussion.

These tools seem very promising (I’m especially interested in the metrics you came up with), but I feel a bit overwhelmed and imagine that others might too. I strongly suggest, for each tool:

  • Make a separate thread introducing it
  • List what types of questions the tool addresses/solves
  • Define all terms/metrics that appear in a tool
  • Sketch up a user manual or help page, describing the functions of the tool and any non-obvious steps during operation

I think this would make your tools much more accessible, especially to technologically challenged folks like myself.

1 Thank

This is a very interesting observation, and I believe one that can be explained.

  • Within the same CCT: since high-CRI spectra are all similar to the reference source, they must be similar amongst themselves. On the other hand, there are many different ways to be low-CRI, introducing more variability for the particular sampling algorithm used by the meter.

Also, low CRI values usually span 50-90, a much wider interval than that spanned by high CRI values, so greater additive error is expected.

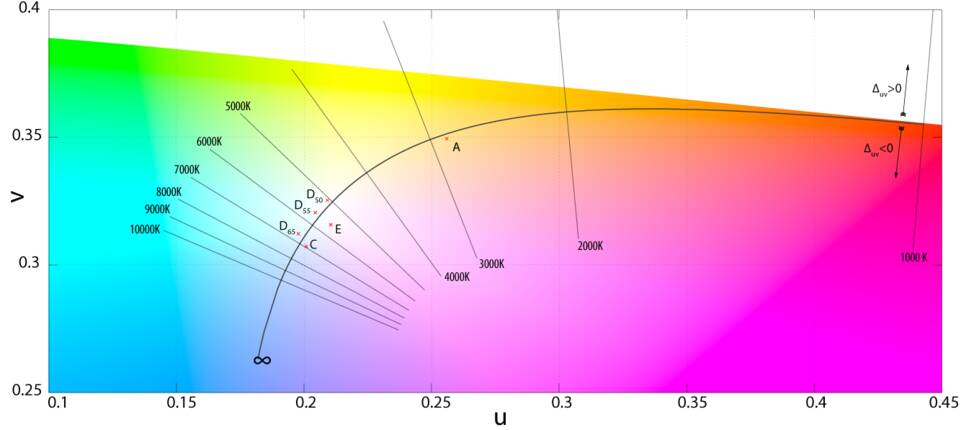
  • Higher CCTs will always have worse additive error in CCT estimation. This can be explained by observing that increments of 1000K become shorter and shorter on the color space as CCT rises:

    Eventually, the same spatial error on the color space can shift a point of finite CCT to a point of infinite CCT, resulting in an additive error of infinity.

Incidentally, this is the reason why some folks prefer using micro-reciprocal degrees (mireds) to quantify color temperature, in a way that accounts for this “compression of the temperature axis” at higher CCTs. The reciprocal transformation is natural in this context for the following reason: the half line of temperatures [∞ K, 0 K] is roughly mapped to the half-line in color space [light blue, infinitely red]. Thus, if one identifies light blue with the number 0 and infinitely red with the number ∞, the reciprocal transformation is the simplest transformation that maps [∞, 0] to [0, ∞].

In other words: if one were to straighten the Planckian locus into the positive x-axis and plot a reciprocal function over it, the function comes pretty close to giving the CCT of that color.

0.0035 is quite a crazy amount of variation, and one easily noticed by an unaided eyeball! Your point of no absolute accuracy comes well supported.

1 Thank